
Previous Story
Daily analysis of USDX for January 16, 2018
Posted On 15 Jan 2018
Comment: 0
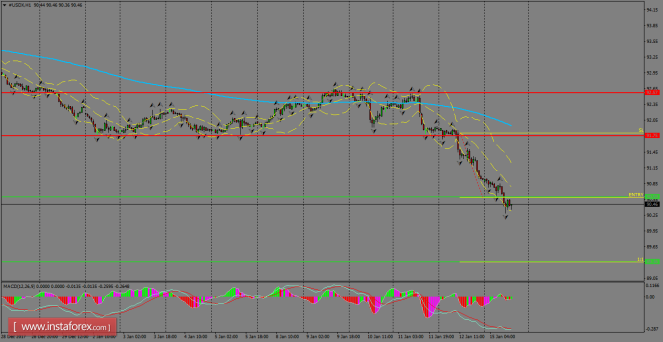
USDX remains under heavy selling pressure, consolidating the price action below the 200 SMA on the H1 chart. The support level of 90.59 is suffering a breakout and such move should help to add more strength to the downside in order to reach the next hurdle around 89.36. The MACD indicator is reaching oversold conditions, calling for a short-term rebound.
H1 chart’s resistance levels: 91.75 / 92.57
H1 chart’s support levels: 90.59 / 89.36
Trading recommendations for today: Based on the H1 chart, place sell (short) orders only if the USD Index breaks with a bearish candlestick; the support level is at 90.59, take profit is at 89.36 and stop loss is at 91.81.
The material has been provided by InstaForex Company – www.instaforex.com


