
Previous Story
Daily analysis of USDX for January 29, 2018
Posted On 29 Jan 2018
Comment: 0
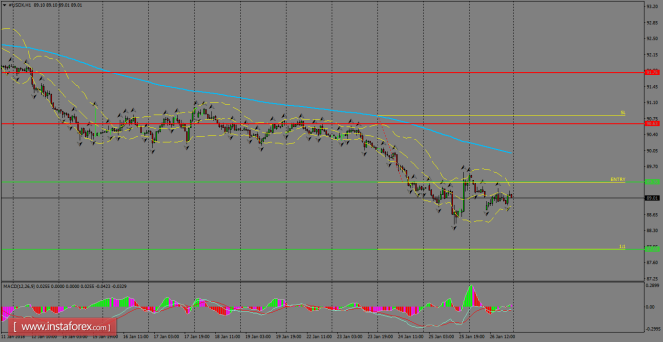
The index continues to trade below the 200 SMA, and it seems we could expect a leg lower towards the support zone of 87.88. However, as USDX didn’t post a new low below the January 25th lows, we could expect a recovery that would take the index to test the 200 SMA at H1 chart. MACD indicator remains in a flat tone.
H1 chart’s resistance levels: 90.63 / 91.75
H1 chart’s support levels: 89.36 / 87.88
Trading recommendations for today: Based on the H1 chart, place sell (short) orders only if the USD Index breaks with a bearish candlestick; the support level is at 89.36, take profit is at 87.88 and stop loss is at 90.81.
The material has been provided by InstaForex Company – www.instaforex.com


