
Previous Story
Daily analysis of USDX for July 24, 2017
Posted On 24 Jul 2017
Comment: 0
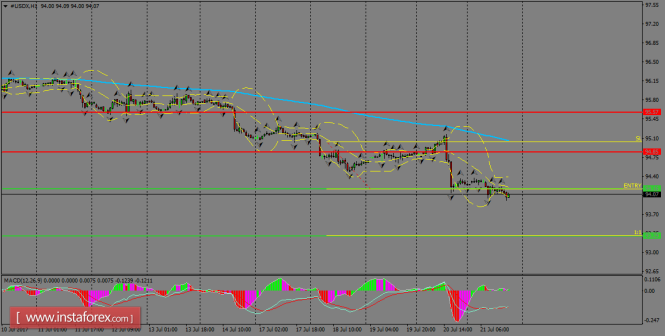
The index continues to be strongly bearish on a short-term basis and looks to break the support level of 94.16, targeting the 93.29 level and it could be reached during this week. The 200 SMA at H1 chart still is setting the tone in the greenback and gains should be limited by that area. MACD indicator is flat, calling for sideways.
H1 chart’s resistance levels: 94.85 / 95.57
H1 chart’s support levels: 94.16 / 93.29
Trading recommendations for today: Based on the H1 chart, place sell (short) orders only if the USD Index breaks with a bearish candlestick; the support level is at 94.16, take profit is at 93.29 and stop loss is at 95.02.
The material has been provided by InstaForex Company – www.instaforex.com


