
Previous Story
Daily analysis of USDX for March 02, 2017
Posted On 02 Mar 2017
Comment: 0
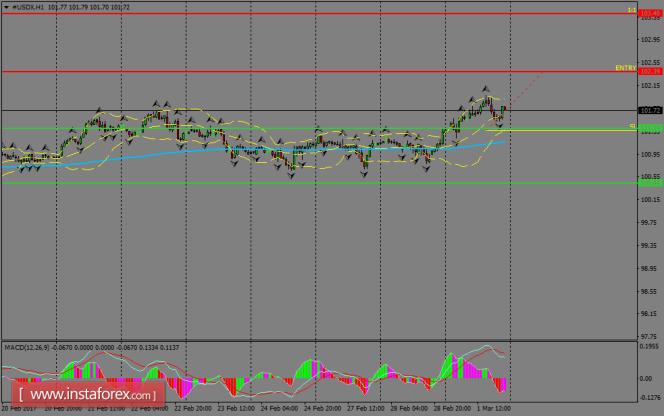
The index is already consolidating the price action well above the 200 SMA at H1 chart, targeting the resistance zone of 102.39. A breakout over there should expose the next key area of 103.40 to the upside, while a pullback should lead the index to establish another sideways range for the short term. MACD indicator is supporting the negative territory.
H1 chart’s resistance levels: 102.39 / 103.40
H1 chart’s support levels: 101.39 / 100.44
Trading recommendations for today: Based on the H1 chart, place buy (long) orders only if the USD Index breaks with a bullish candlestick; the resistance level is at 102.39, take profit is at 103.40 and stop loss is at 101.35.
The material has been provided by InstaForex Company – www.instaforex.com


