
Previous Story
Daily analysis of USDX for March 16, 2017
Posted On 16 Mar 2017
Comment: 0
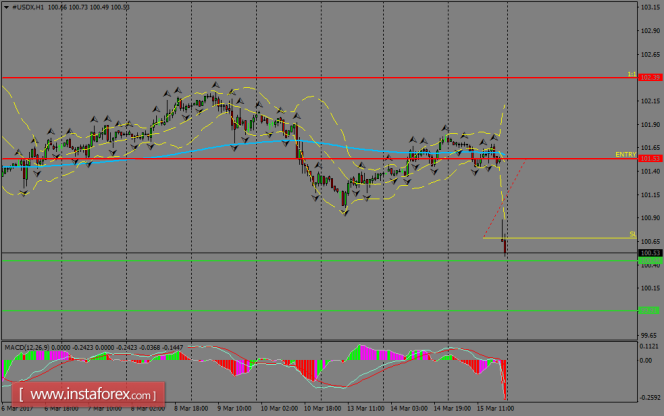
USDX plunged to test the 100.60 level across the board after FOMC’s decision to raise rates by first time in 2017. That bearish move is putting pressure on the index for the short-term, as traders are trying to decide which would be the next path for US Dollar. If a breakout happens below 100.44, then it can reach the 99.91 level.
H1 chart’s resistance levels: 101.53 / 102.39
H1 chart’s support levels: 100.44 / 99.91
Trading recommendations for today: Based on the H1 chart, place buy (long) orders only if the USD Index breaks with a bullish candlestick; the resistance level is at 102.39, take profit is at 103.40 and stop loss is at 100.68.
The material has been provided by InstaForex Company – www.instaforex.com


