
Previous Story
Daily analysis of USDX for March 31, 2017
Posted On 31 Mar 2017
Comment: 0
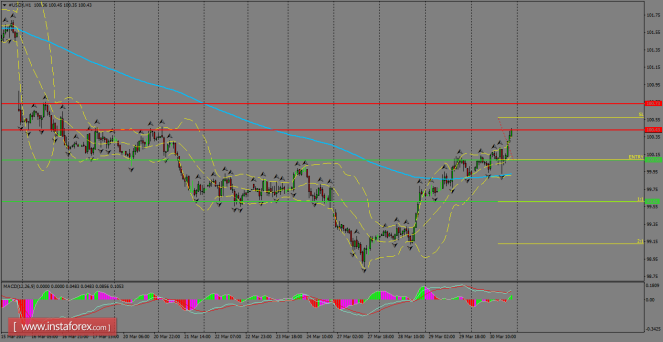
The index is extending the bullish bias above the 200 SMA at H1 chart, looking for the next target placed around 100.73. However, the view is still bearish across the board, but with a strong move above 101 we could shift our outlook to a bullish one, while a pullback to break below the key zone of 100.00 should deliver more bearish force toward 99.61.
H1 chart’s resistance
levels: 100.43 / 100.73
H1 chart’s support levels:
100.08 / 99.61
Trading recommendations for today:
Based on the H1 chart, place
sell (short)
orders only if the USD Index
breaks with
a bearish
candlestick;
the support
level is at
100.08,
take profit is at
99.61
and stop loss is at 100.57.
The material has been provided by InstaForex Company – www.instaforex.com


