
Previous Story
Daily analysis of USDX for November 27, 2017
Posted On 26 Nov 2017
Comment: 0
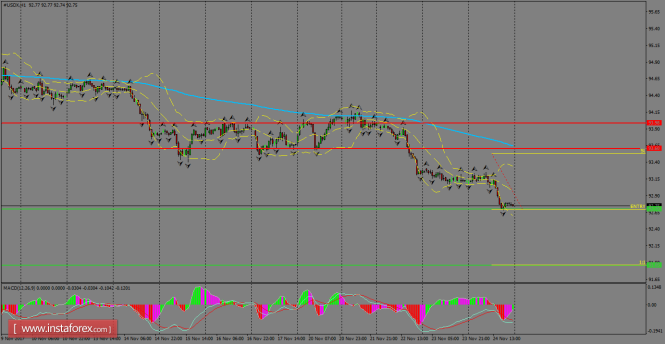
The index remains under pressure below the 200 SMA at H1 chart and the support level of 92.70 still holds across the board, favoring to a lower low pattern formation. If that level gives up, then the next leg lower should extend towards the 91.85 level. However, if USDX manages to rebound at the current stage, then the next target should be the 200 SMA, at which lies the resistance zone of 93.60.
H1 chart’s resistance levels: 93.60 / 93.98
H1 chart’s support levels: 92.70 / 91.85
Trading recommendations for today: Based on the H1 chart, place sell (short) orders only if the USD Index breaks with a bearish candlestick; the support level is at 92.70, take profit is at 91.85 and stop loss is at 93.53.
The material has been provided by InstaForex Company – www.instaforex.com


