
Previous Story
Daily analysis of USDX for September 01, 2017
Posted On 31 Aug 2017
Comment: 0
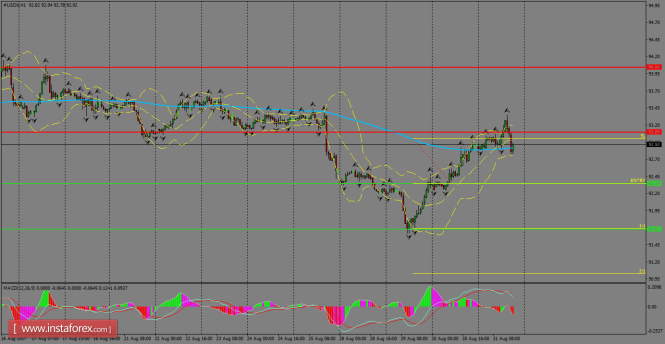
The index remains strong in the recovery phase that has entered and the 200 SMA on the H1 chart is currently challenged. If it manages to overcome that area, we should expect a rally to test the August 17th highs around 94.04. To the downside, the nearest support is placed at the 92.34 level, at which a breakout should open the doors for more weakness.
H1 chart’s resistance levels: 93.09 / 94.04
H1 chart’s support levels: 92.34 / 91.67
Trading recommendations for today: Based on the H1 chart, place sell (short) orders only if the USD Index breaks with a bearish candlestick; the support level is at 92.34, take profit is at 91.67 and stop loss is at 93.00.
The material has been provided by InstaForex Company – www.instaforex.com


