
Previous Story
DXY Has The Double Zigzag Ended?
Posted On 30 Nov 2021
Comment: 0

The formation of the DXY stock index suggests the development of a large triple zigzag consisting of cycle waves w-x-y-x-z.
On the 1H timeframe, we see the second half of a large average wave y, which has the form of a double zigzag Ⓦ-Ⓧ-Ⓨ of the primary degree. Apparently, this double zigzag has come to an end. If this is the case, then shortly the market may turn around and begin to decline in a cycle intervening wave x.
Wave x will be simple as shown by red trend lines and marked with primary waves Ⓐ-Ⓑ-Ⓒ. There is a possibility that prices could reach a minimum of 91.94. At that level, the primary intervening wave Ⓧ ended in early September.
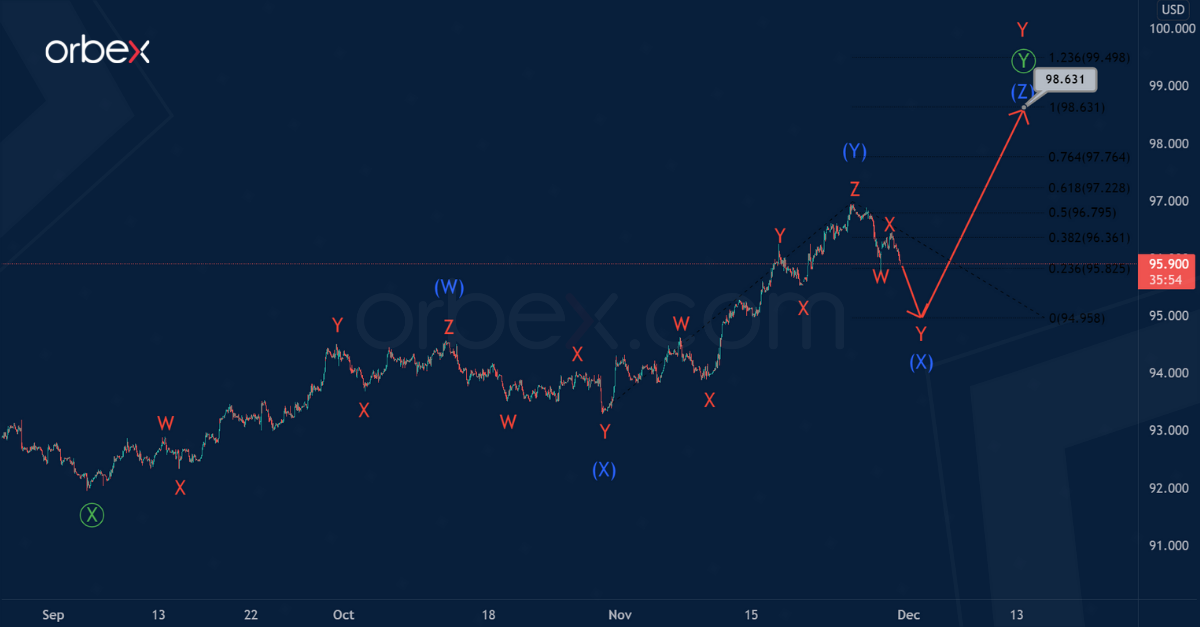
Let’s consider an alternative scenario in which the cycle wave y is not yet complete.
Perhaps its final primary wave Ⓨ will be more complex in its structure. In fact, it can take the form, not of a double, but a triple zigzag consisting of intermediate sub-waves (W)-(X)-(Y)-(X)-(Z).
If that is the case then in the short term, the market could complete the decline in a small reactionary intervening wave (X) in the form of a double zigzag W-X-Y. And then the bulls can push the price to the level of 98.63 in the intermediate wave (Z).
At the specified level, wave (Z) will be equal to the actionary wave (Y).


