
Previous Story
Elliott wave analysis of EUR/JPY for March 27, 2018
Posted On 27 Mar 2018
Comment: 0
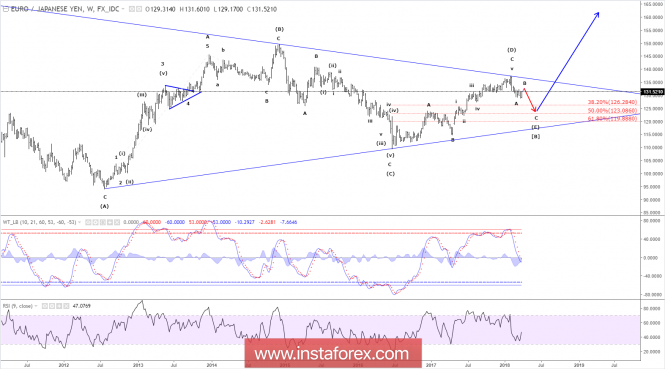
USD/JPY – Weekly
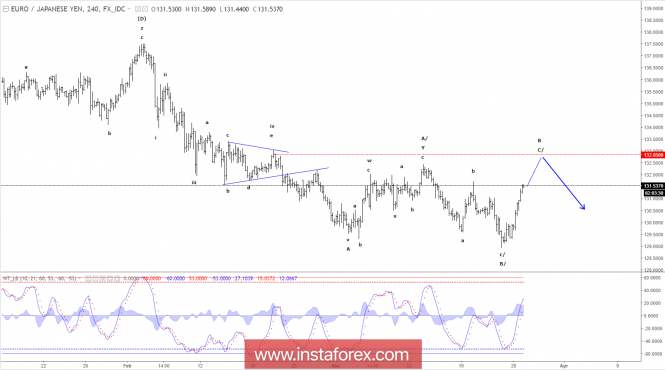
USD/JPY – 4 Hourly
Long-term we continue to look for the wave (E), of a huge triangle, to continue lower to an ideal target near 123.43.
Zooming in on the shorter time-frame, we saw wave (D) complete with the test of 137.50 and since that top, we have seen wave A to a low of 129.53 and wave B is still unfolding as some kind of flat. Wave B could complete near 132.43 but it’s possible that wave C/ of B will extend closer to 132.82 before completing and setting the stage for the next impulsive decline in wave C towards the ideal target near 123.43.
R3: 132.82
R2: 132.42
R1: 131.98
Pivot: 131.72
S1: 131.17
S2: 130.53
S3: 130.24
Trade recommendation:
We will be looking for a selling opportunity in the 132.43 – 132.82 area
The material has been provided by InstaForex Company – www.instaforex.com
Source:: Elliott wave analysis of EUR/JPY for March 27, 2018


