Previous Story
Elliott Wave analysis of Bitcoin for 18/03/2019
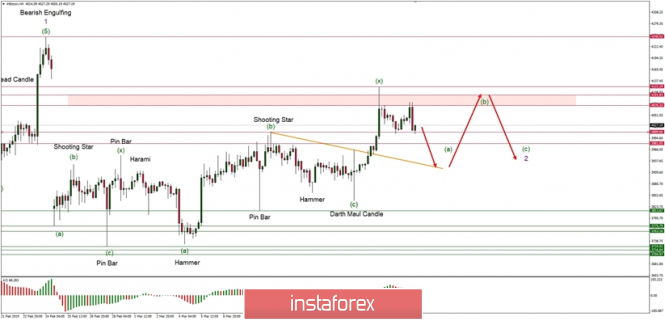
Battle of 61% Fibonacci retracement is still going onhe battle of 61% Fibonacci retracement is still present
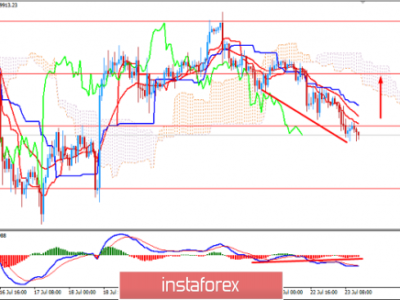
Technical market overview:
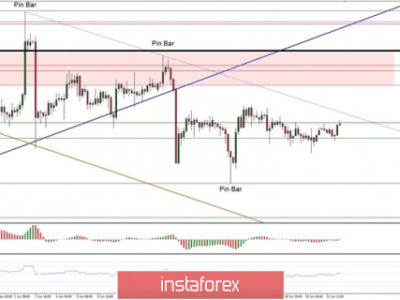
The BTC/USD pair has made a new local high at the level of $4,122 and then suddenly moved down towards the technical resistance located between the levels of $4,076 – $4,101. The bulls were too weak to move higher again and the price has dropped towards the technical support at the level of $4,009. If this level is violated then the low for the wave (a) will be completed and the market will start the local wave (b) and (c). After those two waves are done, the whole corrective cycle in wave 2 will be completed.
Weekly Pivot Points:
WR3 – $4,456
WR2 – $4,282
WR1 – $4,180
Weekly Pivot – $4,000
WS1 – $3,897
WS2 – $3,712
WS3 – $3,614
Trading recommendations:
Due to the unfinished corrective cycle in the wave (a) (b) and (c) the sell orders should be placed as close as possible to the level of $4,076 with a protective stop loss above the level of $4,112.
The material has been provided by InstaForex Company – www.instaforex.com