Previous Story
Elliott Wave analysis of Bitcoin for 19/03/2019
Technical market overview:
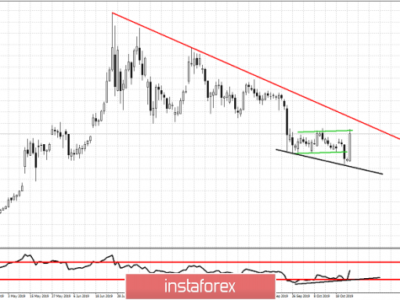
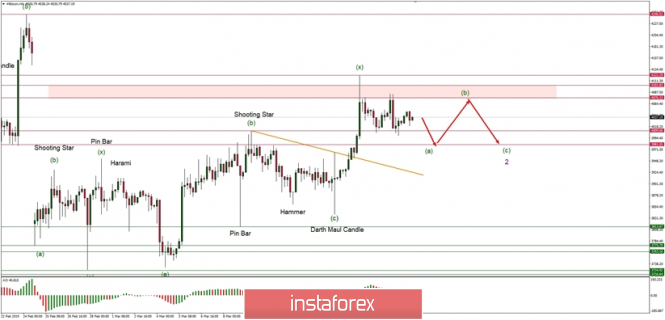
The BTC/USD pair has been trading in a horizontal zone between the levels of $4,000 – $4,080 for some time now, but the bias remains to the downside. The Bearish Engulfing candlestick pattern is the reason behind the bearish bias and the unfinished down cycles of the wave (a), (b) and (c). If the level of $3,891 is violated then the low for the wave (a) will be completed and the market will start the local wave (b) and (c). When those two waves are done, the whole corrective cycle in wave 2 will be completed.
Weekly Pivot Points:
WR3 – $4,456
WR2 – $4,282
WR1 – $4,180
Weekly Pivot – $4,000
WS1 – $3,897
WS2 – $3,712
WS3 – $3,614
Trading recommendations:
Due to the unfinished corrective cycle in the wave (a) (b) and (c) the sell orders should be placed as close as possible to the level of $4,076 with a protective stop loss above the level of $4,112.
The material has been provided by InstaForex Company – www.instaforex.com