
Previous Story
Ethereum Elliott Wave analysis for 11/02/2019
Technical market overview:
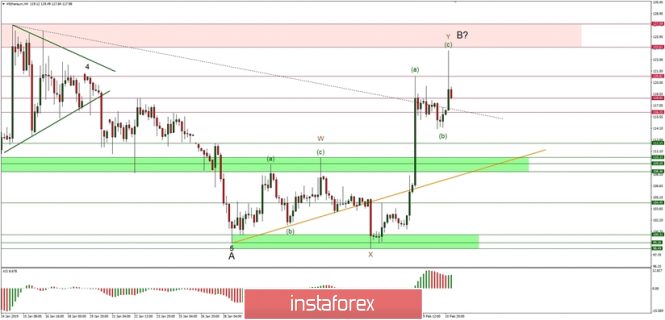
The ETH/USD pair has broken out of the horizontal consolidation and on the way up the technical resistance zone located at 108.46 – 110.33 (now support) had been clearly violated. The price had made a new local high at the level of 124.10 before the local pull-back has started. The pull-back has not been finished yet as the target for bears is seen at the level of 112.15 or even 110.33. There is a clear bearish divergence between the wave (a) and wave (c) highs, so this supports the short-term bearish outlook.
Weekly Pivot Points:
WR3 – 149.94
WR2 – 135.39
WR1 – 127.42
Weekly Pivot – 112.16
WS1 – 105.12
WS2 – 90.45
WS3 – 82.23
Trading recommendations:
The pair is might have completed the upward corrective cycle, so only the sell orders should be opened as close as possible to the level of 120.81 – 124.10 with a protective stop loss placed above the level of 124.61. The target is the technical support at the level of 112.15 and 110.33.
The material has been provided by InstaForex Company – www.instaforex.com


