
Previous Story
Ethereum Elliott Wave analysis for 19/02/2019
Ethereum Elliott Wave analysis for 19/02/2019:
The resistance was tested, pull-back now?
Technical market overview:
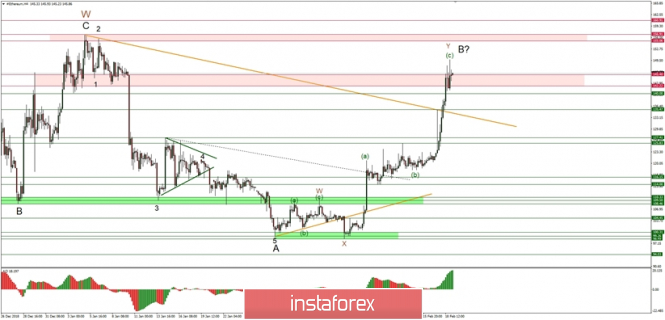
The ETH/USD pair has hit the technical resistance zone located between the levels of 142.22 – 145.20 and broke through it towards the level of 149.72 (new local high). The momentum was very solid behind this move up, but it still looks like the wave (c) of the overall corrective cycle in the wave B. Moreover, this might be the top for wave B and the wave C to the downside might be unfolding soon.
Currently, the nearest technical support is seen at the level of 140.00 and then at 135.47. Any violation of the orange trend line will support the view that the top for wave B is in place already.
Weekly Pivot Points:
WR3 – $158
WR2 – $149
WR1 – $138
Weekly Pivot – $126
WS1 – $118
WS2 – $106
WS3 – $99
Trading recommendations:
All of the buy orders that were bought yesterday ha shit the projected targets. Currently, daytraders should try to buy the ETH on the local corrections towards the levels of 140.00 and 135.47 with a tight protective stop-loss order.
The material has been provided by InstaForex Company – www.instaforex.com


