
Previous Story
Ethereum Elliott Wave analysis for 21/02/2019
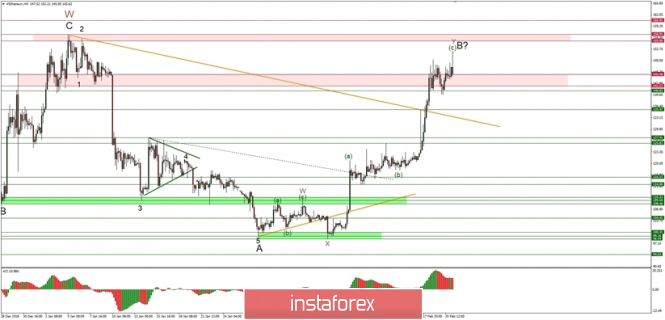
Technical market overview:
The ETH/USD pair has made a new local high at the level of 153.20, but the candlestick pattern that emerges at the h4 time-frame chart looks like a Shooting Star, so the up move might be terminated soon. Moreover, this might be the top for wave B, so the wave C to the downside might be unfolding soon and the first confirmation that the top is in place will be the breakout below the nearest technical support at the level of 140.83. The next technical supports are seen at the levels of 140.00 and then at 135.47.
Weekly Pivot Points:
WR3 – $158
WR2 – $149
WR1 – $138
Weekly Pivot – $126
WS1 – $118
WS2 – $106
WS3 – $99
Trading recommendations:
The aggressive traders might try to short the ETH again in the zone of 150.00 – 153.00 with a tight protective stop loss and wait for the price to hit the level of 140.83, 140.00 or 135.47. Any violation of the last mentioned level will only accelerate the sell-off towards the level of 127.41.
The material has been provided by InstaForex Company – www.instaforex.com


