
Previous Story
EUR/USD: plan for the European session on Apr 10, 2020
To open long positions on EURUSD you need:
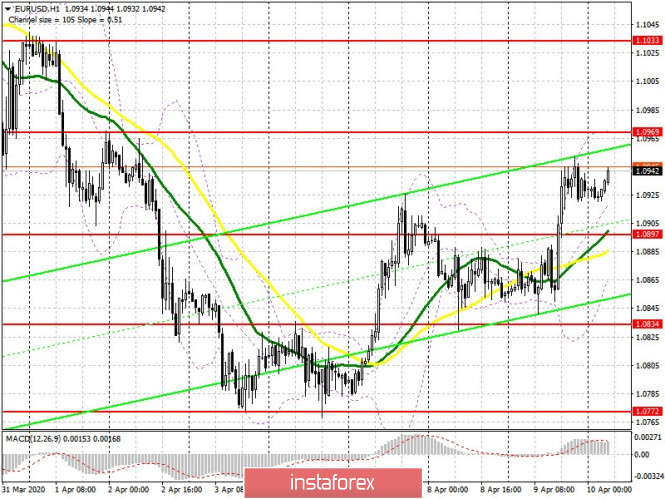
Yesterday’s news that the eurozone finance ministers managed to agree on a package of measures worth 0.5 trillion euros supported the European currency, which managed to resume its upward trend. Weak fundamental data on a sharp increase in the number of unemployed in the US put additional pressure on the US dollar. At the moment, an important task for euro buyers is to protect the support of 1.0897, where the formation of a false breakout will be a signal to open long positions in the hope of continuing growth in the short term. There are also moving averages below this level, which will provide additional support. The nearest target of the bulls is the resistance of 1.0969, where there could be problems with the breakout. Consolidating above this level will open a direct path to the highs of 1.1033 and 1.139, where I recommend taking profits.
To open short positions on EURUSD you need:
It is Good Friday today and markets are closed in several countries, which will have a significant impact on volatility, but also provide an opportunity for speculators. The primary task of euro sellers is to form a false breakout in the resistance area of 1.0969, which will be a signal to open short positions in the expectation of a decline to the support of 1.0897, where today I advise you to take profits. Poor data on inflation in the US will certainly lead to a breakout of this low, as it will strengthen demand for safe-haven assets, which will open a direct road to the support area of 1.0834. If the demand for the euro remains in the resistance area of 1.0969, it is best to postpone short positions until the test of the high of 1.1033, from where you can expect a correction of 30-40 points within the day.
Signals of indicators:
Moving averages
Trade is conducted above 30 and 50 moving averages, which indicates further continued growth of the euro.
Note: The period and prices of moving averages are considered by the author on the hourly chart H1 and differs from the general definition of the classic daily moving averages on the daily chart D1.
Bollinger bands
Growth will be limited by the upper level of the indicator in the region of 1.0969, and in case the pair falls, the lower border in the 1.0875 area will provide support.
Description of indicators
- Moving average (moving average determines the current trend by smoothing out volatility and noise). Period 50. The graph is marked in yellow.
- Moving average (moving average determines the current trend by smoothing out volatility and noise). Period 30. The graph is marked in green.
- MACD indicator (Moving Average Convergence / Divergence – moving average convergence / divergence) Fast EMA period 12. Slow EMA period 26. SMA period 9
- Bollinger Bands (Bollinger Bands). Period 20
The material has been provided by InstaForex Company – www.instaforex.com


