
Previous Story
EUR/USD: plan for the European session on Apr 13, 2020
To open long positions on EURUSD, you need:
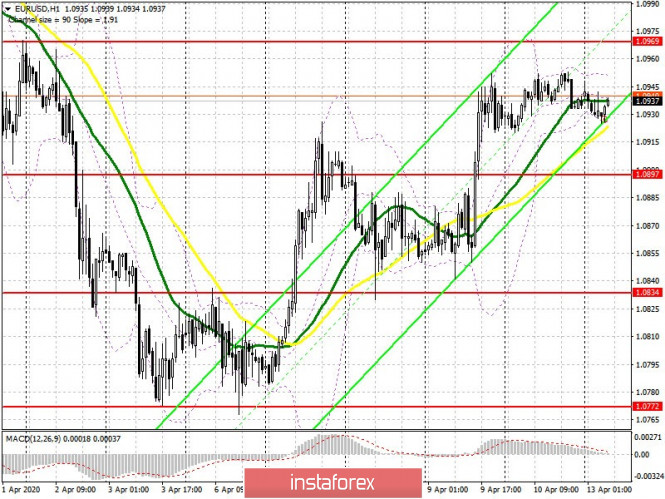
Given the closure of a number of European markets on Friday, as well as low volatility and trading volume, traders did not react strongly to the report on US inflation, which declined by 0.4%, while economists forecast a decline of 0.3%. The weak report was highly predictable considering current events in the world, which did not lead to a change in the technical picture of the EUR/USD pair in the short term. At the moment, an important task for euro buyers is to protect the support of 1.0897, where the formation of a false breakout will be a signal to open long positions in the expectation of continuing growth around the new highs of 1.0969 and 1.1033, where there could be problems with the breakout. Consolidation above the 1.0969 level will open a direct path to the area of 1.139, where I recommend taking profits. In case of a sharp decline today, the euro is below the 1.0897 level, which is unlikely, since many markets are closed due to Easter Monday, long positions can be returned immediately to rebound from the low of 1.0834.
To open short positions on EURUSD, you need:
The primary task of sellers of the euro is to form a false breakout in the resistance area of 1.0969, which will be a signal to open short positions in the expectation of a decline to the support of 1.0897, where I recommend taking profits. Important fundamental statistics are not expected today, except for the speech of the Federal Reserve representatives, so the lack of demand for the euro in the area of 1.0897 may result in a sharper fall to the low of 1.0834, where I recommend taking profits. If there are no active sales at the level of 1.0969 in the first half of the day, it is best to postpone short positions until the test of the high of 1.1033, from where you can expect a correction of 30-40 points within the day.
Signals of indicators:
Moving averages
Trade is carried out in the region of 30 and 50 moving average, which indicates the lateral nature of the market with a slight advantage to buyers of the euro.
Note: The period and prices of moving averages are considered by the author on the hourly chart H1 and differs from the general definition of the classic daily moving averages on the daily chart D1.
Bollinger bands
A break of the upper boundary of the indicator in the reg ion of 1.0955 will lead to a larger growth of the euro in the short term. A break of the lower boundary in the region of 1.925 will increase the pressure on the pair.
Description of indicators
- Moving average (moving average determines the current trend by smoothing out volatility and noise). Period 50. The graph is marked in yellow.
- Moving average (moving average determines the current trend by smoothing out volatility and noise). Period 30. The graph is marked in green.
- MACD indicator (Moving Average Convergence / Divergence – Moving Average Convergence / Divergence) Fast EMA period 12. Slow EMA period 26. SMA period 9
- Bollinger Bands (Bollinger Bands). Period 20
The material has been provided by InstaForex Company – www.instaforex.com


