
Previous Story
EUR/USD: plan for the European session on Apr 16, 2020
To open long positions on EURUSD, you need:
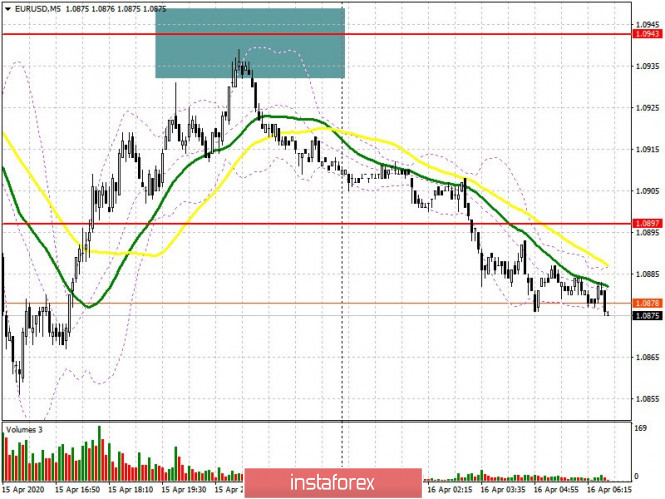
Yesterday’s news that the German economy will begin to gradually open, and enterprises and companies will start to function on April 20, managed to stop the avalanche-like fall of the European currency. However, bears are still focused on updating new lows. In my review for the second half of the day, I advised opening short positions from the 1.0943 level, which made it possible for you to earn around 50 points. This is clearly visible on the 5-minute chart. For today, the primary task of euro buyers will be to return the resistance of 1.0905 in the first half of the day, which determines the further upward correction in the pair. Consolidating on this range will lead to a larger increase in EUR/USD to the highest area of 1.0965, where I recommend taking profits. Weak German inflation could raise the pressure on the euro. Therefore, it is best to expect purchases in the event of a fall from the low of 1.0835, or even lower, from the support of 1.0772, where larger players will show themselves.
To open short positions on EUR USD you need:
The primary task of sellers of the euro is to form a false breakout in the resistance area of 1.0905, just above which the moving averages pass, which will be a signal to open short positions. The main goal of this week is to pull down the euro to the support of 1.0835. However, weak reports on German inflation may lead to a sharper decline to the low of 1.0772, where I recommend taking profits. Traders will also focus on the report on the number of applications for unemployment benefits in the US, which will be released in the afternoon, which may lead to the formation of a new wave of decline in the pair. In the scenario of EUR/USD growth above the resistance of 1.0905 in the first half of the day, it is best to return to short positions only for a rebound from the high of 1.0965, counting on a correction of 40-50 points within the day.
Signals of indicators:
Moving averages
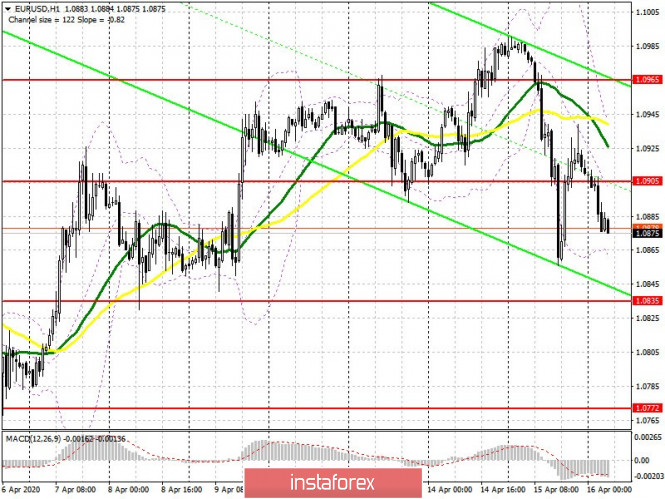
Trading is below 30 and 50 moving averages, which indicates a bearish market sentiment.
Note: The period and prices of moving averages are considered by the author on the hourly chart H1 and differs from the general definition of the classic daily moving averages on the daily chart D1.
Bollinger bands
A break of the lower border of the indicator at 1.0860 will lead to a new wave of decline for the euro. You can sell on the rebound from the upper border in the area of 1.0935.
Description of indicators
- Moving average (moving average determines the current trend by smoothing out volatility and noise). Period 50. The graph is marked in yellow.
- Moving average (moving average determines the current trend by smoothing out volatility and noise). Period 30. The graph is marked in green.
- MACD indicator (Moving Average Convergence / Divergence – moving average convergence / divergence) Fast EMA period 12. Slow EMA period 26. SMA period 9
- Bollinger Bands (Bollinger Bands). Period 20
The material has been provided by InstaForex Company – www.instaforex.com


