
Previous Story
EUR/USD: plan for the European session on August 2, 2019 The US dollar fell after a slowdown in growth in the manufacturing sector
To open long positions on EURUSD you need:
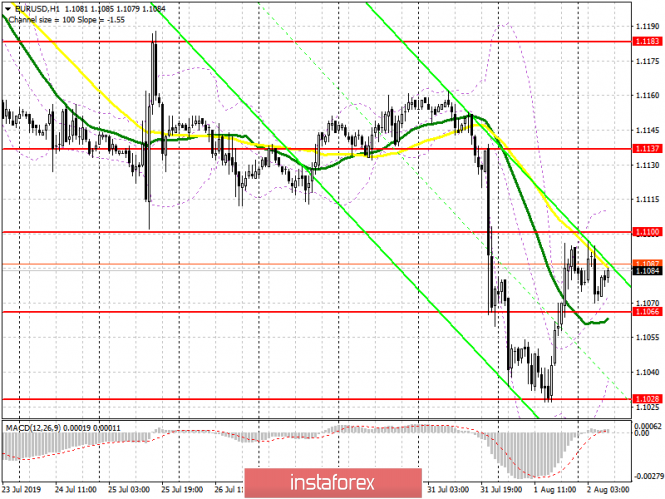
Euro buyers took advantage of a weak report on the ISM manufacturing index and managed to return yesterday to the resistance level of 1.1066, on which further growth today depends on. As long as trade is conducted above this range, we can expect a continuation of the upward correction in the resistance area of 1.1100, above which it will be extremely difficult to break through. In the event of weak data on the volume of retail trade in the eurozone, an attempt to fall to the support level of 1.1066 is not excluded. The formation of a false breakout on it will be an additional signal to open long positions in EUR/USD. Otherwise, you can buy immediately to rebound from a low of 1.1028. The task of the bulls will to consolidate above the resistance of 1.1100, which will strengthen the upward correction in the pair and will lead to an update of the high of 1.1137, where I recommend to take profit.
To open short positions on EURUSD you need:
Sellers will be waiting for data on retail and producer prices in the eurozone. Weak reports will help form a false breakdown in the resistance area of 1.1100, which will again increase the pressure on the euro and lead the bears to the support level of 1.1066, on which further movement will depend. A breakthrough will increase the pressure on EUR/USD and open the way to this week’s low in the area of 1.1028, where I recommend taking profits. If buyers manage to consolidate in the first half of the day above the resistance of 1.1100, then it is best to rely on short positions after updating the resistance of 1.1137. However, the main movement will depend on data on the US labor market, which we will discuss in more detail in the review for the second half of the day.
Indicator signals:
Moving averages
Trade is conducted in the region of 30 and 50 moving averages, which indicates market uncertainty.
Bollinger bands
In case the euro declines, support will be provided by the lower limit of the indicator in the 1.1035 area. The upward correction will be limited to the upper line of the indicator in the area of 1.1107.
Description of indicators
- MA (moving average) 50 days – yellow
- MA (moving average) 30 days – green
- MACD: fast EMA 12, slow EMA 26, SMA 9
- Bollinger Bands 20
The material has been provided by InstaForex Company – www.instaforex.com


