
Previous Story
EUR/USD: plan for the European session on Dec 20, 2019
To open long positions on EURUSD, you need:
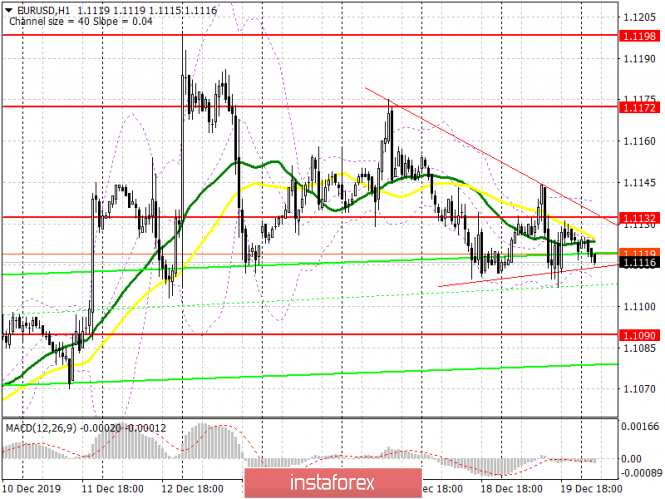
Yesterday, the bears once again did not let the pair above the resistance of 1.1132, and the same task of the bulls today is to return to this range. Data on the consumer climate and consumer spending index of the eurozone countries can help with this. Good indicators will return EUR/USD to 1.1132, which will lead to a breakdown of the downward triangle and a larger upward correction in the area of highs of 1.1172 and 1.1198, where I recommend taking the profits. In the scenario of lack of activity among buyers above the level of 1.1132, I recommend to postpone long positions until the update of the minimum of 1.1090, and in the case of a larger fall in the euro, after the data on the US economy, it is best to consider new purchases on the rebound from the area of 1.1041.
To open short positions on EURUSD, you need:
Sellers are actively defending the resistance of 1.1132. Yesterday’s data on US economy made it possible to form a triangle and break of its lower boundary, which coincides with intermediate resistance around 1.1110, will increase the pressure on the euro, which will bring the pair to a minimum of 1.1090, and then open the way to a more distant target in the area of 1.1041, where I recommend fixing the profit. An unsuccessful consolidation above the resistance of 1.1132, which may occur in the first half of the day after the release of statistics on the eurozone countries, will also be an additional signal to open short positions in the euro. The main task is to prevent the renewal of yesterday’s maximum, as such a scenario will lead to a return of demand for the euro. In this case, short positions are best postponed until the update of this week’s highs at 1.1172, or after the update of the monthly resistance at 1.1198.
Indicator signals:
Moving Averages
Trading is conducted in the area of 30 and 50 moving averages, which indicates the lateral nature of the market.
Bollinger Bands
Breaking the upper limit of the indicator around 1.1140 will lead to the growth of the European currency. The breakdown of the lower border, which coincides with the support of 1.1110, will increase the pressure on the euro.
Description of indicators
- Moving average (moving average determines the current trend by smoothing volatility and noise). Period 50. The chart is marked in yellow.
- Moving average (moving average determines the current trend by smoothing volatility and noise). Period 30. The chart is marked in green.
- MACD indicator (Moving Average Convergence / Divergence – Convergence / Divergence of moving averages) – EMA Period 12. Slow EMA Period 26. SMA Period 9
- Bollinger Bands (Bollinger Bands). Period 20
The material has been provided by InstaForex Company – www.instaforex.com


