
Previous Story
EUR/USD: plan for the European session on Dec 27, 2019
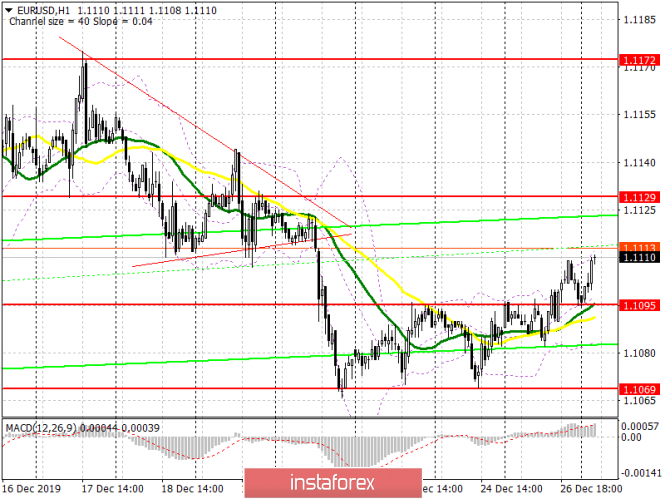
To open long positions on EURUSD you need:
Buyers of the euro coped with the task yesterday, and despite the fact that data on the US labor market came out according to the forecast of economists, where the number of initial applications for unemployment benefits increased by 222,000, they continued to push the pair above the level of 1.1095. At the moment, all emphasis is on this range, but already as support. The formation of a false breakout there will be a signal to open long positions in the continuation of the upward correction to the area of highs 1.1129 and 1.1172, where I recommend taking profits. However, given the lack of important fundamental data in the morning, in addition to the publication of an economic bulletin from the European Central Bank, the lack of activity at the level of 1.1095 may lead to the pair returning to the area of a low of 1.1069, where I recommend opening long positions immediately for a rebound.
To open short positions on EURUSD you need:
Sellers need to regain the level of 1.1095, which they tried to protect all this week. Only a decrease below this range will increase the pressure on the pair and lead to a downward correction to the support area of 1.1069, a breakthrough of which will provide the bears with a direct path to the lows of 1.1041 and 1.1004, where I recommend taking profit there. If there is no pressure on the euro in the first half of the day and the upward correction continues, short positions can be returned from the level of 1.1129, subject to the formation of a false breakout there. But I recommend selling the pair immediately for a rebound only in the resistance area of 1.1172, the test of which will indicate the formation of a new upward trend in the euro.
Signals of indicators:
Moving averages
Trade is conducted slightly above 30 and 50 moving averages, which indicates that it is possible for the euro to grow in the short term.
Bollinger bands
If the pair decreases, support will be provided by the lower boundary of the indicator in the region of 1.1080.
Description of indicators
- Moving average (moving average determines the current trend by smoothing out volatility and noise). Period 50. The graph is marked in yellow.
- Moving average (moving average determines the current trend by smoothing out volatility and noise). Period 30. The graph is marked in green.
- MACD indicator (Moving Average Convergence / Divergence – moving average convergence / divergence) Fast EMA period 12. Slow EMA period 26. SMA period 9
- Bollinger Bands (Bollinger Bands). Period 20
The material has been provided by InstaForex Company – www.instaforex.com
Source:: EUR/USD: plan for the European session on December 27. Bulls need to protect support at 1.1095


