
Previous Story
EUR/USD: plan for the European session on Feb 11, 2020
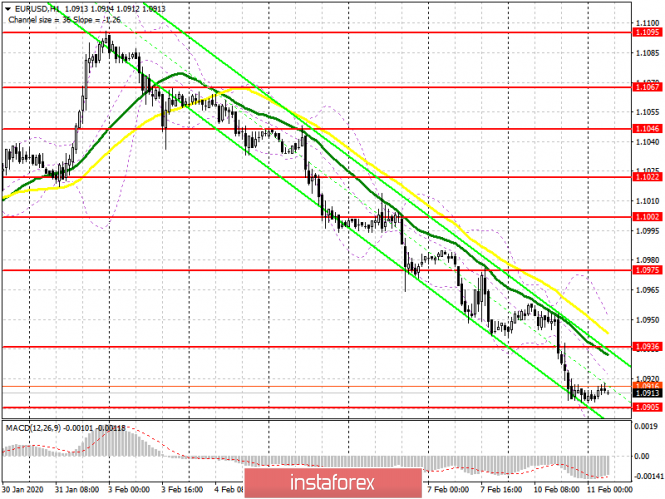
To open long positions on EURUSD you need:
Yesterday’s disappointing report on Italy’s industrial output and the Federal Reserve’s confident statements on growth in the US economy this year have kept demand for the US dollar, which led to another decline in the EUR/USD pair to a new support level of 1.0907. The first priority of buyers is to keep this area and to form a low in the area. A false breakout will be the first signal to open long positions, which will cause the pair to return to the area of a large resistance level of 1.10936, where I recommend taking profits. However, this should happen all with a surge in volume. If there is no volume, the market will go down further. In this scenario, it is best to open new long positions after testing a low of 1.0878, or immediately to rebound from the 1.0840 area. Statements by European Central Bank Chief Christine Lagarde may help the euro in the afternoon, but we’ll talk about this later. It is also necessary to pay attention to the high probability of divergence, which can occur on the MACD indicator after an update of yesterday’s low at 1.0895.
To open short positions on EURUSD you need:
Sellers will wait for the next weak data on the European economy, however, opening short positions on yesterday’s low breakout is quite a dangerous occupation, since the pair has been declining for six trading days in a row since the beginning of February without any upward correction. A better option for sales in the morning will be the formation of a false breakout in the resistance area of 1.0936, which will be a signal to open short positions with the main goal of returning to a low of 1.0907, on which the further downward movement depends. A break and consolidation below this range will quickly push EUR/USD down to the lows of 1.0878 and 1.0840, where I recommend taking profits. If the activity on the part of sellers, as well as good volume, is not in the resistance area of 1.0936, then in this case it is best to return to short positions to rebound from a high of 1.0975.
Signals of indicators:
Moving averages
Trade is conducted below 30 and 50 moving averages, which indicates the predominance of sellers in the market.
Bollinger bands
In case of growth in the first half of the day, the upper boundary of the indicator at 1.0950 will act as resistance. Support will be provided by the lower boundary at 1.0895, where divergence may also form.
Description of indicators
- Moving average (moving average determines the current trend by smoothing out volatility and noise). Period 50. The graph is marked in yellow.
- Moving average (moving average determines the current trend by smoothing out volatility and noise). Period 30. The graph is marked in green.
- MACD indicator (Moving Average Convergence / Divergence – Moving Average Convergence / Divergence) Fast EMA period 12. Slow EMA period 26. SMA period 9
- Bollinger Bands (Bollinger Bands). Period 20
The material has been provided by InstaForex Company – www.instaforex.com


