
Previous Story
EUR/USD: plan for the European session on Feb 28, 2020
To open long positions on EURUSD you need:
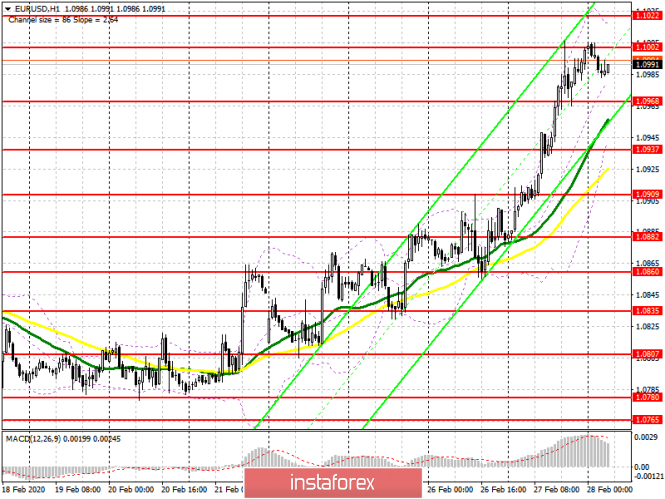
Correction in the US stock market (the S&P 500), which lost more than 13% over the week, has a positive effect on the European currency, but the test of the 10th figure may limit further upside potential, so be careful with purchasing at current highs. Yesterday’s weak data on the US economy also acted as a catalyst for the euro’s growth. However, it is worth saying that today’s breakthrough of resistance at 1.1002 will be accompanied by a bearish divergence on the MACD indicator, which will limit the growth of the pair. It is best to return to long positions after correction and the formation of a false breakout in the support area of 1.0968, or buy immediately for a rebound from a low of 1.0937. Under the scenario of good fundamental statistics for the countries of the eurozone, and today there are quite a lot of them, a break and consolidation above the resistance of 1.1002 will lead EUR/USD to new highs in the areas of 1.1022 and 1.1046, where I recommend taking profits.
To open short positions on EURUSD you need:
The large increase in the euro did not leave a single chance for the sellers yesterday. Today, bears will try their best to prevent the growth of the European currency above the resistance of 1.1002, which may coincide with the bearish divergence on the MACD indicator. A false breakout of 1.1002, after updating yesterday’s highs, will be a signal to open short positions in the calculation of a correction to the lows of 1.0968 and 1.0937, where I recommend taking profits. If the data on inflation and the labor market in Germany turn out to be better than forecasts of economists, then it is best to return to short positions after updating the high of 1.1022, and larger sellers will retreat to the resistance of 1.1046.
Signals of indicators:
Moving averages
Trading is conducted above 30 and 50 moving averages, which indicates the likelihood of further upward correction of the euro. With a decrease in the pair, the moving averages will also act as support.
Bollinger bands
Growth will be limited by the upper indicator level in the region of 1.1020, while the lower boundary in the area of 1.0935 will support.
Description of indicators
- Moving average (moving average determines the current trend by smoothing out volatility and noise). Period 50. The graph is marked in yellow.
- Moving average (moving average determines the current trend by smoothing out volatility and noise). Period 30. The graph is marked in green.
- MACD indicator (Moving Average Convergence / Divergence – moving average convergence / divergence) Fast EMA period 12. Slow EMA period 26. SMA period 9
- Bollinger Bands (Bollinger Bands). Period 20
The material has been provided by InstaForex Company – www.instaforex.com


