
Previous Story
EUR/USD: plan for the European session on Jan 10, 2020
To open long positions on EURUSD you need:
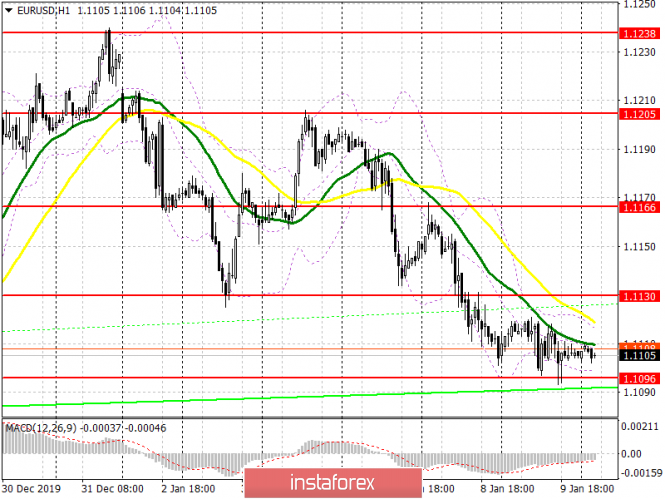
Yesterday’s weekly report on the US labor market, as well as statements by the Federal Reserve representatives, did not significantly affect the technical picture of the pair, which made it possible for euro buyers to stay above the support of 1.1096. While trading is above this range, the main emphasis today in the morning will be at 1.1130, a break and consolidation above which will be a signal to open new long positions, counting on updating highs 1.1166 and 1.1205, where I recommend taking profits. Also, one should not forget about the support of 1.1096, an update of which, together with the formation of a false breakout, will also indicate that the euro could likely grow in the short term. Otherwise, it is best to open long positions in EUR/USD by rebounding from the lows of 1.1069 and 1.1041.
To open short positions on EURUSD you need:
The downward trend continues, and sellers, even despite yesterday’s failure with a break of 1.1096, continue to control the market. Now their main task for the first half of the day will be the formation of a false breakout in the resistance area of 1.1130. This scenario may come true even before the publication of an important report on the number of people employed in the non-agricultural sector. However, the bear’s no less important task will be to break through and secure below support at 1.1096, which will increase pressure on EUR/USD and lead to updating lows 1.1069 and 1.1041, where I recommend taking profits. However, such a scenario will be probable only in the case of a good growth in the number of employees, which will exceed the forecasts of economists. In the scenario of a return of EUR/USD resistance at 1.1130, it is best to consider short positions for a rebound from highs 1.1166 and 1.1205.
Signals of indicators:
Moving averages
Trading is conducted below 30 and 50 moving averages, which indicates the advantage of euro sellers.
Bollinger bands
A break of the lower boundary of the indicator in the region of 1.1096 will be a signal to sell the euro. Growth will be limited by the upper level of the indicator in the area of 1.1116, a breakthrough of which will increase demand.
Description of indicators
- Moving average (moving average determines the current trend by smoothing out volatility and noise). Period 50. The graph is marked in yellow.
- Moving average (moving average determines the current trend by smoothing out volatility and noise). Period 30. The graph is marked in green.
- MACD indicator (Moving Average Convergence / Divergence – moving average convergence / divergence) Fast EMA period 12. Slow EMA period 26. SMA period 9
- Bollinger Bands (Bollinger Bands). Period 20
The material has been provided by InstaForex Company – www.instaforex.com


