
Previous Story
EUR/USD: plan for the European session on Jan 29, 2020
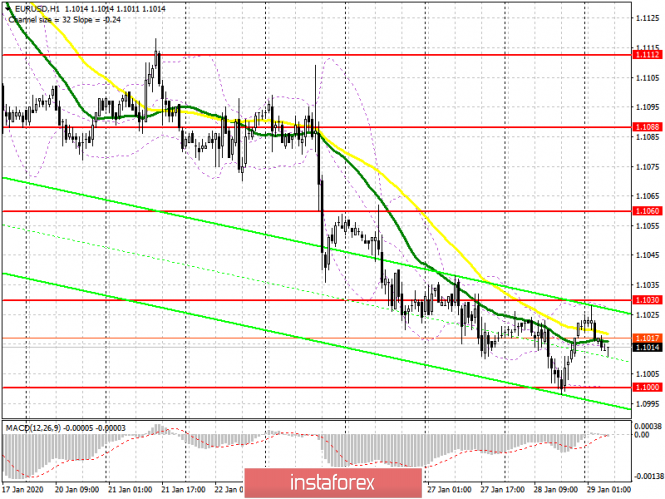
To open long positions on EURUSD you need:
Yesterday’s data on the growth of the consumer confidence indicator in the United States made it possible for major players to take profits in the US dollar ahead of the Federal Reserve meeting, which led to the formation of an upward correction in the EUR/USD pair, which, judging by the divergences in the MACD indicator, has been asking for quite some time. At the moment, the bulls have the task of overcoming the resistance of 1.1030, since on this level it depends whether the pair will continue to grow further and whether the downward trend will be broken. Consolidation above 1.1030 will lead to the renewal of highs in the region of 1.1060, but a larger bullish impulse is formed only if the Fed declares that the policy of low interest rates will be maintained. In case the pair declines in the morning, you can still return to long positions after a false breakout is formed in the support area of 1.1000, but I recommend buying the euro immediately for a rebound only after updating the lows of 1.0982 and 1.0964.
To open short positions on EURUSD you need:
Bears coped with the task of updating support of 1.1004 yesterday, which has now transformed to the level of 1.1000, but failed to break below this range even amid good statistics, which indicates a wait-and-see attitude of large players before the Fed’s decision on interest rates. The task of euro sellers is to form a false breakout in the resistance area of 1.1030 today, which will be the first signal to open short positions. Consolidation below the level of 1.1000 will push the pair to the lows of 1.0982 and 1.0964, where I recommend taking profits. In the EUR/USD growth scenario above the resistance of 1.1030, short positions are best postponed until the highs of 1.1060 are updated, or sell immediately for a rebound in the resistance area of 1.1088.
Signals of indicators:
Moving averages
Trade is conducted in the region of 30 and 50 moving average, which indicates the formation of a side channel in the short term ahead of important data.
Bollinger bands
A break of the upper boundary of the indicator in the region of 1.1030 will lead to an increase in demand for the euro. Support will be provided by the lower boundary in the area of 1.1000.
Description of indicators
- Moving average (moving average determines the current trend by smoothing out volatility and noise). Period 50. The graph is marked in yellow.
- Moving average (moving average determines the current trend by smoothing out volatility and noise). Period 30. The graph is marked in green.
- MACD indicator (Moving Average Convergence / Divergence – moving average convergence / divergence) Fast EMA period 12. Slow EMA period 26. SMA period 9
- Bollinger Bands (Bollinger Bands). Period 20
The material has been provided by InstaForex Company – www.instaforex.com


