
Previous Story
EUR/USD: plan for the European session on Jan 6, 2020
To open long positions on EURUSD you need:
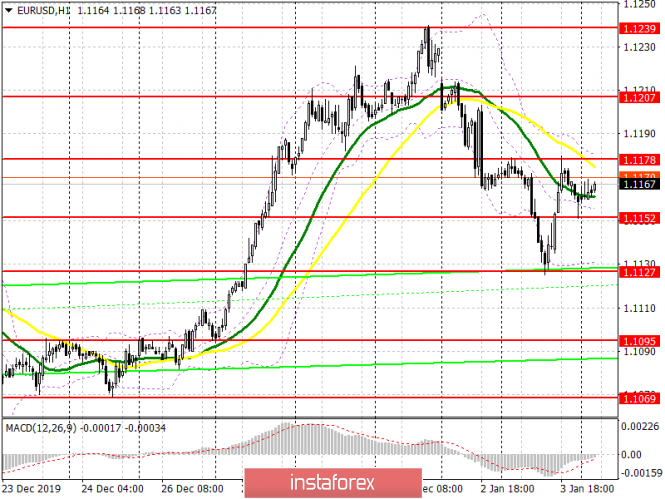
Friday’s German inflation data, which sharply rose in December last year, is good news for the European Central Bank, as well as for euro buyers, who are now rushing to the level of 1.1178, and on which a further upward correction depends. A break and consolidation above this range, along with a good report on the services sector of the eurozone countries, could lead to further growth of EUR/USD to the highs of 1.1207 and 1.1239, where I recommend taking profits. In case of weak reports and poor performance at eurozone producer prices, it is best to return to long positions only after a false breakout has formed in the support area of 1.1152, and I recommend buying the euro for a rebound only after updating the lows of 1.1127 and 1.1095.
To open short positions on EURUSD you need:
Sellers will be waiting for a weak report on the eurozone services sector, which has recently continued to demonstrate stability. Only the formation of a false breakout in the resistance area of 1.1178 will maintain pressure in the EUR/USD pair, and the first target of sellers will be to support 1.1152. In the scenario of its breakout, we can count on a larger bearish momentum already in the area of lows 1.1127 and 1.1095, where I recommend taking profits. If sellers are not able to cope with resistance at 1.1178 in the morning, then you can return to short positions after a test of a high at 1.1207, or sell the euro immediately to rebound from resistance at 1.1239.
Signals of indicators:
Moving averages
Trading is carried out in the region of 30 and 50 moving average, which indicates the lateral nature of the market and the likely completion of the bearish correction.
Bollinger bands
If the pair decreases, support will be provided by the lower boundary of the indicator in the region of 1.1130. The upper boundary of the indicator in the region of 1.1180 will act as resistance, a break through which will lead to an increase in the euro.
Description of indicators
- Moving average (moving average determines the current trend by smoothing out volatility and noise). Period 50. The graph is marked in yellow.
- Moving average (moving average determines the current trend by smoothing out volatility and noise). Period 30. The graph is marked in green.
- MACD indicator (Moving Average Convergence / Divergence – moving average convergence / divergence) Fast EMA period 12. Slow EMA period 26. SMA period 9
- Bollinger Bands (Bollinger Bands). Period 20
The material has been provided by InstaForex Company – www.instaforex.com


