
Previous Story
EUR/USD: plan for the European session on Jan 8, 2020
To open long positions on EURUSD you need:
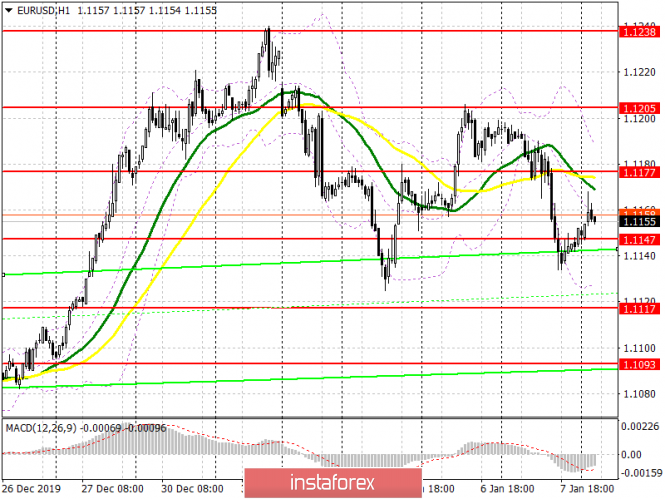
Yesterday’s statistics on the US economy once again indicated a stable end to 2019, which supported the US dollar against the euro. The aggravation of the military conflict between the United States and Iran has also increased the demand for the dollar. However, despite the decline in the pair, it is too early to write off euros from buyers’ accounts. Today they are faced with the task of maintaining the level of 1.1147, the formation of which a false breakout will be the first signal to open long positions in the pair. An equally important goal will be to return and consolidate above the resistance of 1.1177, which will quickly return EUR/USD to the area of a high of 1.1205, where I recommend taking profits. If pressure on the euro will continue in the morning, and this can happen after the release of weak reports on German industry orders and the eurozone consumer confidence indicator, then I recommend returning to long positions after breaking support for 1.1147 only when the low of 1.1117 is updated, or buy EUR/USD immediately to rebound from the area of 1.1093.
To open short positions on EURUSD you need:
Sellers are gradually building a downward trend and today they will strive for a breakout of support at 1.1147. Consolidating below this level will increase pressure on the euro and push it down to lows of 1.1117 and 1.1093, where I recommend taking profits. A more optimal signal to open short positions in the pair would be an unsuccessful consolidation above resistance at 1.1177, a test of which can occur today in the morning. Otherwise, it is best to consider new EUR/USD sales for a rebound from the highs of 1.1205 and 1.1238. Fundamental statistics on the US economy related to the labor market will also help the dollar grow against the European currency.
Signals of indicators:
Moving averages
Trading is slightly below 30 and 50 moving averages, which indicates a turning point in the direction of euro sellers.
Bollinger bands
In case the pair declines, support will be provided by the lower boundary of the indicator in the region of 1.1125. The upper boundary of the indicator in the region of 1.1190 will act as resistance.
Description of indicators
- Moving average (moving average determines the current trend by smoothing out volatility and noise). Period 50. The graph is marked in yellow.
- Moving average (moving average determines the current trend by smoothing out volatility and noise). Period 30. The graph is marked in green.
- MACD indicator (Moving Average Convergence / Divergence – moving average convergence / divergence) Fast EMA period 12. Slow EMA period 26. SMA period 9
- Bollinger Bands (Bollinger Bands). Period 20
The material has been provided by InstaForex Company – www.instaforex.com


