
Previous Story
EUR/USD: plan for the European session on Mar 18, 2020
To open long positions on EURUSD, you need:
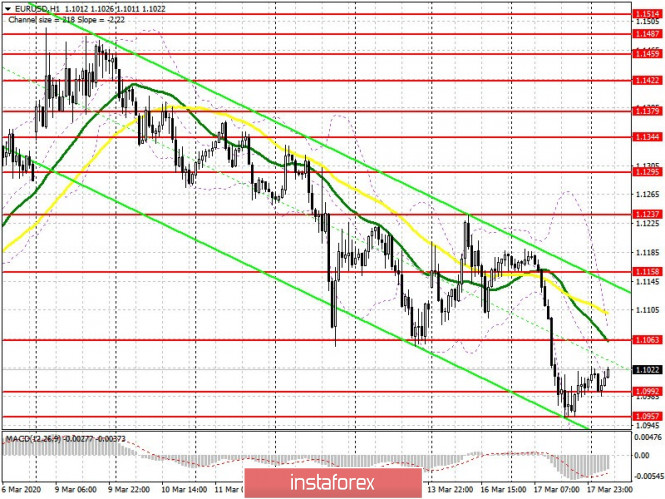
In my review for the US session, I recommended buying from the support in the area of 1.0957, from which the pair rebounded upwards. Yesterday’s weak reports on the US economy, especially in the area of retail sales, which declined sharply in February this year, although led to a slight rebound of the EUR/USD pair from its intraday lows, but in general the situation remains under the control of sellers. Buyers of the euro need to protect the support of 1.0992 today, since only the formation of a false breakout there will be a signal to open long positions, and this requires good data on inflation in the eurozone, which is not worth counting on. If the pressure on the euro returns, and the pair falls under the support of 1.0992 in the first half of the day, in this scenario, it is best to open long positions only after updating the low of 1.0909, or buy EUR/USD immediately on the rebound from the area of 1.0882 in the calculation of a correction of no more than 30-40 points within the day.
To open short positions on EUR USD you need:
The US is preparing to adopt a package of measures worth $1 trillion, which will be aimed at supporting the economy during the spread of the coronavirus, which is good news for investors. Meanwhile, the bears continue to control the market and today we are waiting for a fairly important report on inflation in the eurozone. If we see its slowdown, we can expect a second wave of sell-offs of the European currency. Sellers only need to return and consolidate below the support of 1.0992, which will quickly pull down EUR/USD to the lows of 1.0909 and 1.0882. I would already count on the 1.0957 area as support. A more interesting scenario for opening short positions will be an upward correction to the highest area of 1.1063 and the formation of a false breakout there after the test of moving averages. I recommend selling the euro immediately for a rebound only after meeting a major resistance of 1.1158.
Signals of indicators:
Moving averages
Trading is carried out below 30 and 50 moving average, which saves the likelihood of a further downward trend in the pair.
Bollinger bands
In case the euro falls, the lower boundary of the indicator in the 1.09573 area will support it, while growth may be limited by the upper level of the indicator in the area of 1.1063, a break which will lead to a larger upward correction.
Description of indicators
- Moving average (moving average determines the current trend by smoothing out volatility and noise). Period 50. The graph is marked in yellow.
- Moving average (moving average determines the current trend by smoothing out volatility and noise). Period 30. The graph is marked in green.
- MACD indicator (Moving Average Convergence / Divergence – moving average convergence / divergence) Fast EMA period 12. Slow EMA period 26. SMA period 9
- Bollinger Bands (Bollinger Bands). Period 20
The material has been provided by InstaForex Company – www.instaforex.com


