
Previous Story
EUR/USD: plan for the European session on Mar 26, 2020
To open long positions on EURUSD you need:
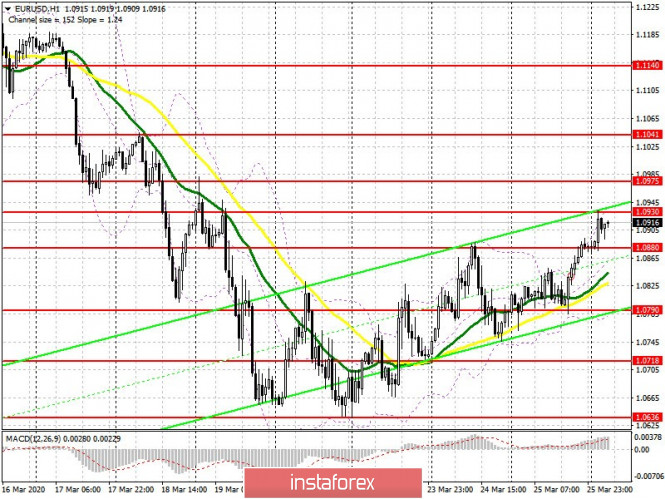
Yesterday’s purchases of European currency in the afternoon made it possible for the pair to maintain an upward correctional trend, and today’s update of the next weekly high indicates the bulls’ presence in the market, counting on the euro’s growth. The adoption by the US Senate of a bill to allocate $2 trillion to support the economy affected by the coronavirus could lead to further strengthening of EUR/USD. To do this, the bulls need to cling to the resistance of 1.0930, from which the upward correction will continue to the area of new highs of 1.0975 and 1.1041, where I recommend taking profits. However, a more optimal scenario for new purchases will still be when a false breakout forms in the support area of 1.0880, and it is even better to return to long positions immediately to rebound from a low of 1.0790. Today’s Economic Bulletin from the European Central Bank, which will be published in the morning, is unlikely to make major changes in the alignment of forces in the market.
To open short positions on EURUSD you need:
Euro sellers are not yet very active and are waiting for more suitable levels. The task of the bears in the first half of the day will be to form a false breakout in the resistance area of 1.0930, which will lead to increased pressure on the pair and a fall below the support of 1.0880. Under this level, the pressure on the euro is likely to increase, which will lead EUR/USD to return to the area of a low of1.0790, where I recommend taking profits. If the bulls turn out to be more persistent and achieve a breakthrough of resistance at 1.0930, it is best to return to short positions in the first half of the day only to rebound from resistance 1.0975, or even higher, in the region of a high of 1.1041, counting on a correction of 50-60 points within the day.
Signals of indicators:
Moving averages
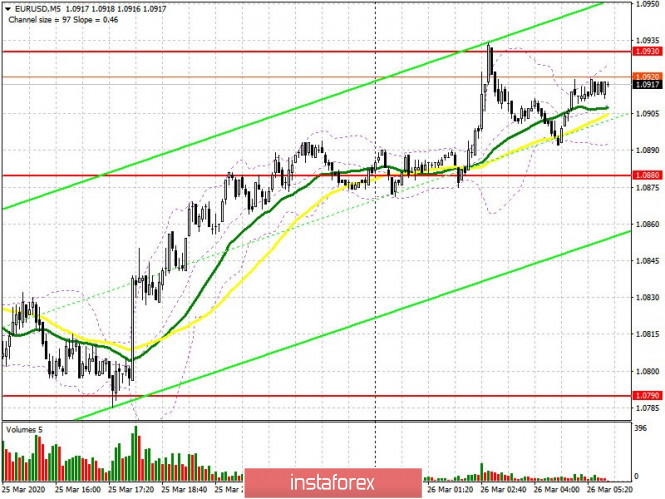
Trading is conducted above 30 and 50 moving average, which indicates the continuation of the upward correction.
Bollinger bands
A break of the upper boundary of the indicator in the region of 1.0940 will lead to a new wave of euro growth. In the event of a decline, the pair will be supported by the lower boundary of the indicator in the 1.0790 area.
Description of indicators
- Moving average (moving average determines the current trend by smoothing out volatility and noise). Period 50. The graph is marked in yellow.
- Moving average (moving average determines the current trend by smoothing out volatility and noise). Period 30. The graph is marked in green.
- MACD indicator (Moving Average Convergence / Divergence – moving average convergence / divergence) Fast EMA period 12. Slow EMA period 26. SMA period 9
- Bollinger Bands (Bollinger Bands). Period 20
The material has been provided by InstaForex Company – www.instaforex.com


