
Previous Story
EUR/USD: plan for the European session on Nov 25, 2019
To open long positions on EURUSD you need:
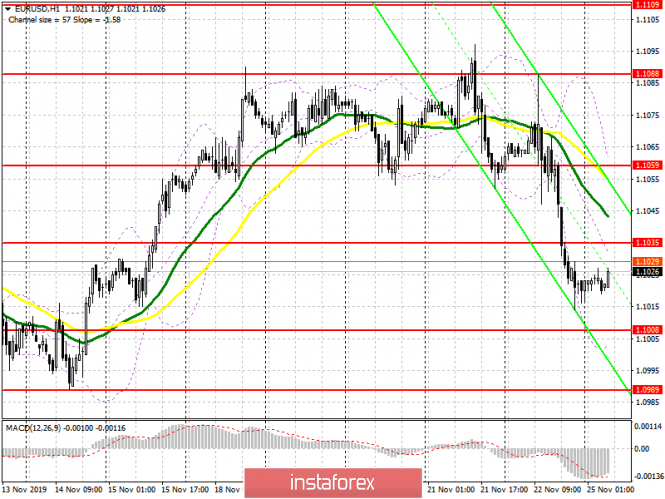
The release of weak reports on the activity of the service sector and production in the eurozone led to a breakout of the lower boundary of the past side channel and the sale of EUR/USD at the end of last week. Currently, all buyers’ attention is focused on the resistance of 1.1035, since only consolidation above this level will lead to a larger upward correction to the area of 1.1059, where I recommend profit taking. However, one can count on such growth only after the release of good reports from the IFO Institute, which are expected in the morning. Under the scenario of further downward movement, the bulls will do their best to cling to the support of 1.1008, however, there will only be a signal to buy on the formation of a false breakout. Otherwise, it is best to open long positions on a rebound from a low of 1.0989.
To open short positions on EURUSD you need:
Sellers managed to push support at 1.1055 last Friday and now the primary goal is to maintain the resistance level of 1.1035. The formation of a false breakout on it, along with weak reports on Germany from the IFO institute, can lead to a new wave of EUR/USD decline. However, a more powerful downward momentum will be formed only after the bears consolidate below the support of 1.1008, which will quickly pull down the euro to lows of 1.0989 and 1.0972, where I recommend profit taking. If there is no bearish activity in the morning near the high of 1.1035, it is best to postpone selling the euro until the renewal of the larger resistance of 1.1059.
Signals of indicators:
Moving averages
Trading is conducted below 30 and 50 moving averages, which indicates a bearish nature of the market.
Bollinger bands
In case of an upward correction, updating the upper boundary of the indicator in the region of 1.1059 will be a good signal to open short positions. The downward movement can be restrained by the lower boundary of the indicator in the region of 1.1000.
Description of indicators
- Moving average (moving average determines the current trend by smoothing out volatility and noise). Period 50. The graph is marked in yellow.
- Moving average (moving average determines the current trend by smoothing out volatility and noise). Period 30. The graph is marked in green.
- MACD indicator (Moving Average Convergence / Divergence – Moving Average Convergence / Divergence). Fast EMA period 12. Slow EMA period 26. SMA period 9.
- Bollinger Bands (Bollinger Bands). Period 20.
The material has been provided by InstaForex Company – www.instaforex.com


