
Previous Story
EUR/USD: plan for the European session on Nov 6, 2019
To open long positions on EURUSD you need:
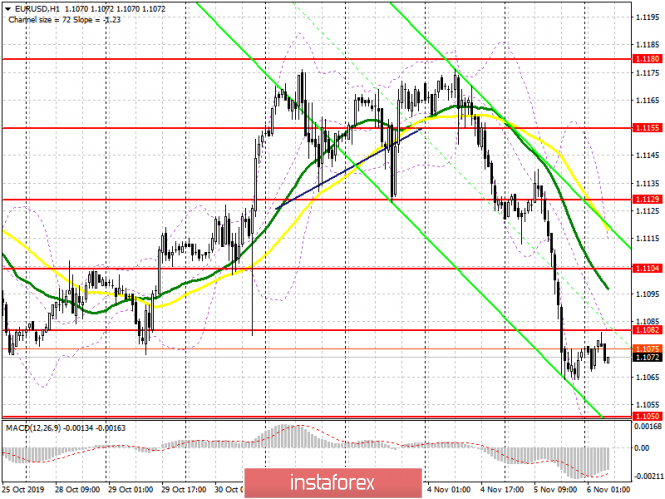
Yesterday’s eurozone reports disappointed traders. Today there is a series of data on the services sector of the eurozone countries along with the composite PMI index, which may support the euro in the morning. An update of the level of 1.1050 with confirmation of the divergence, which is now being formed on the MACD indicator, will be a direct signal to open long positions in the expectation of a return to a resistance of 1.1082. However, it will be possible to count on a larger upward correction only after the growth and consolidation of EUR/USD above 1.1082, which will lead to an update of the high of 1.1104, where I recommend profit taking. In the absence of demand for the euro in the region of a low of 1.1050, it is best to count on new long positions on a rebound from support of 1.1026 and 1.0994.
To open short positions on EURUSD you need:
Sellers coped with all the tasks set at the beginning of the week, and now is the time to retreat from the market for a small correction. However, the calculation so far is based on data on the service sector, which may also show a slowdown due to the manufacturing sector. The formation of a false breakout in the resistance area of 1.1082 will be another signal to sell the euro in order to update the support of 1.1050, where I recommend profit taking. However, do not forget about the high probability of divergence on the MACD indicator, which can form after a test of level of 1.1050. Only its real breakdown will lead to a larger sale of EUR/USD to the area of lows 1.1026 and 1.0994. If the data turns out to be better than economists’ forecasts, and the bulls regain the level of 1.1082, it is best to count on short positions after updating the highs of 1.1104 and 1.1129.
Signals of indicators:
Moving averages
Trading is conducted below 30 and 50 moving averages, which indicates a bearish nature of the market.
Bollinger bands
In case of growth, the upper boundary of the indicator in the region of 1.1120 will act as resistance. In case of decrease, support will be provided by the lower boundary of the indicator in the region of 1.1050.
Description of indicators
- MA (moving average) 50 days – yellow
- MA (moving average) 30 days – green
- MACD: Fast EMA 12, Slow EMA 26, SMA 9
- Bollinger Bands 20
The material has been provided by InstaForex Company – www.instaforex.com


