
Previous Story
EUR/USD: plan for the US session on Jan 6, 2020
To open long positions on EURUSD, you need:
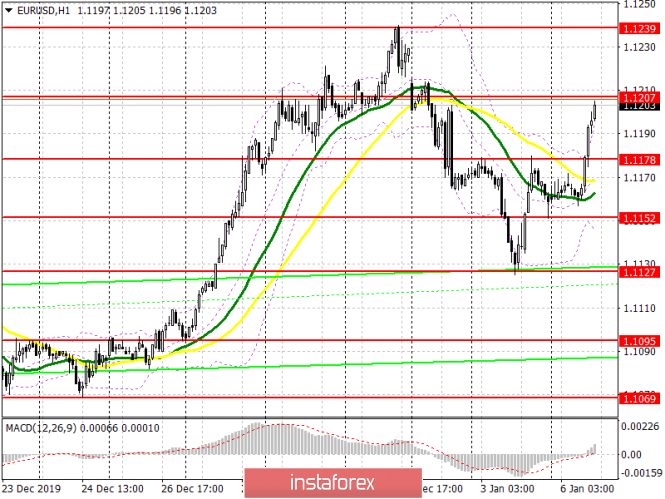
Data on the services sector of the eurozone countries is quite expected to return the demand for the European currency in the first half of the day, which I drew attention to in my morning forecast. The growth of producer prices in the eurozone also supported the bullish momentum. At the moment, buyers have reached the resistance of 1.1207, choosing above which will be more problematic. Only weak data on the US economy will allow us to gain a foothold above this range, which will quickly return EUR/USD to the area of highs of 1.1239 and 1.1263, where I recommend fixing the profits. In the scenario of the pair’s decline in the second half of the day, you can look at long positions if a false breakout is formed in the support area of 1.1178, or buy the euro immediately on a rebound from the minimum of 1.1152.
To open short positions on EURUSD, you need:
Sellers will be active after the resistance test of 1.1207, however, opening short positions in the afternoon is best after the formation of a false breakout, which can be formed as a result of good growth indicators in the activity in the US service sector and composite PMI. In the scenario of no pressure on the euro around the level of 1.1207, I recommend considering short positions only after the maximum update in the area of 1.1239. An equally important task for sellers will be to return EUR/USD to the support area of 1.1178, which was missed today and was still resistance in the morning. Closing the market below this area will keep the advantage on the side of the bears, which in the future will allow the pair to return to the lows of 1.1152 and 1.127.
Indicator signals:
Moving Averages
Trading is above the 30 and 50 moving averages, which indicates a return of bullish momentum after a downward correction at the beginning of the year.
Bollinger Bands
If the euro falls, the lower border of the indicator around 1.1140 will provide support.
Description of indicators
- Moving average (moving average determines the current trend by smoothing out volatility and noise). Period 50. The graph is marked in yellow.
- Moving average (moving average determines the current trend by smoothing out volatility and noise). Period 30. The graph is marked in green.
- MACD indicator (Moving Average Convergence / Divergence – Convergence / Divergence moving average) Fast EMA Period 12. Slow EMA Period 26. SMA Period 9
- Bollinger Bands (Bollinger Bands). Period 20
The material has been provided by InstaForex Company – www.instaforex.com


