
Previous Story
EUR/USD: technical review 29.03.2019
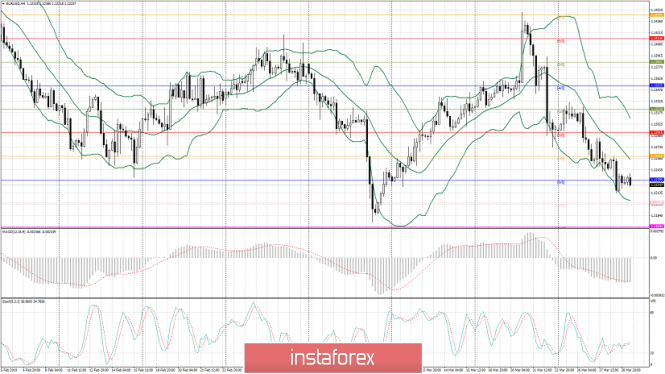
Current dynamic
On the 4-hour chart, EURUSD pair is showing a negative dynamic. Now the pair is trying to consolidate below the level of 1.1230 (Murray [0/8]), which is the key level for the sellers in the short-term period. Assuming the pair’s ability to cross down 1.1213 mark (3-week low), the levels of 1.1200 (Murray [-1/8])-1.1169 (Murray [-2/8]) can be targeted if holding short positions. There is a high chance of an upward rebound around the area of 1.1169 level, while its breakdown would allow the price fall to the level of 1.1118. Alternatively, pullback above 1.1261 level which coincided with the middle line of Bollinger Bands, could lead EUR/USD to the levels of 1.1291 (Murray [2/8])-1.1322 (Murray [3/8]).
Technical indicators reflect the maintenance of the downward potential, but the upward correction is possible in the short term. Bollinger Bands are pointed downwards. Stochastic lines are pointed upwards. MACD histogram is in the negative zone keeping a signal for the opening of sell positions.
Support and resistance:
Support levels: 1.1213, 1.1200, 1.1169, 1.1118.
Resistance levels: 1.1261, 1.1291, 1.1322, 1.1352.
Trading scenarios:
Short positions can be opened below the level of 1.1200 with the target at around 1.1169-1.1118 and stop-loss 1.1226.
Long positions can be opened above the level of 1.1261 with the target at around 1.1291-1.1322 and stop-loss 1.1240.
The material has been provided by InstaForex Company – www.instaforex.com
Source:: EUR/USD: technical review 29.03.2019


