
Previous Story
EUR/USD analysis for April 05, 2017
Posted On 05 Apr 2017
Comment: 0
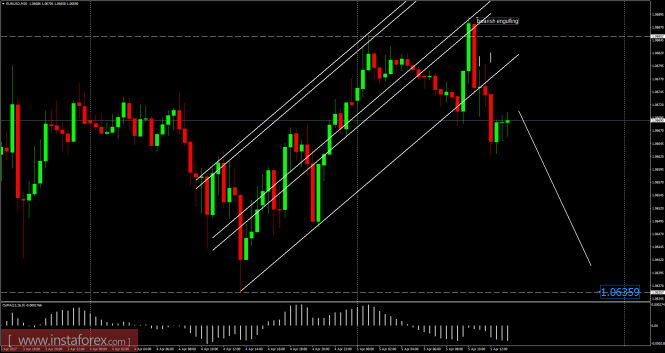
Recently, the EUR/USD pair has been trading sideways at the price of 1.0670. According to the 30M timeframe, I found broken bearish upward channel and bearish engulfing candlestick pattern, which is a sign that buying looks risky. There is also a fake breakout of yesterday’s high, which is another sign of weakness. My advice is to watch for potential selling opportunities. The first downward target is set at the price of 1.0635.
Resistance levels:
R1: 1.0690
R2: 1.0705
R3: 1.0735
Support levels:
S1: 1.0645
S2: 1.0620
S3: 1.0600
Trading recommendations for today: watch for potential selling opportunities.
The material has been provided by InstaForex Company – www.instaforex.com
Source:: EUR/USD analysis for April 05, 2017


