Previous Story
Forecast for AUD/USD pair on Sept 13, 2019
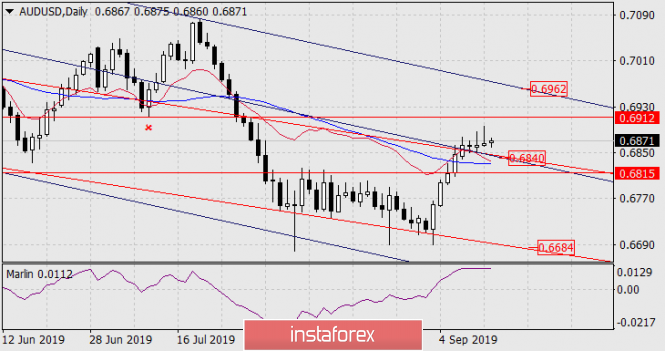
AUD / USD pair
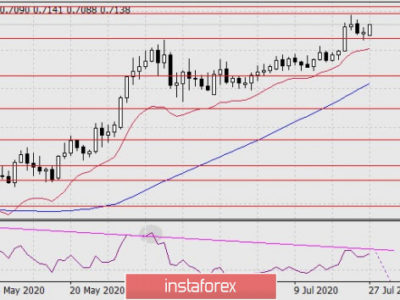
The Australian dollar is growing very slowly over the most important technical resistances that have now become supports. These are the trend lines of two price channels, the MACDindicator line and the balance indicator line on the daily scale chart. Oscillator Marlin draws a horizontal line. Such a pattern may mean continued growth on the depletion of the market, that is, the price and the indicator itself will still show growth but you need to be careful about it. The immediate goal of the bulls remains at 0.6912 and overcoming the level opens the second target of 0.6962, which is the upper border of the price channel. The departure of the price under the strong support of 0.6840, which is unlikely, will launch a new stage of lowering the “Australian” to support the embedded line of the price channel at 0.6684.
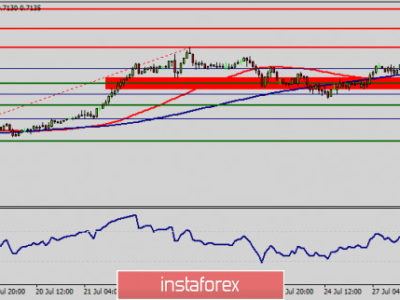
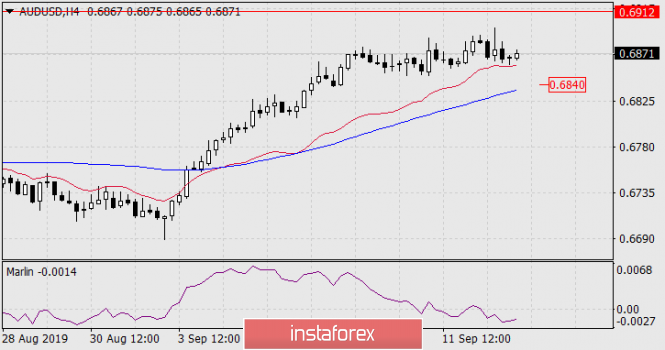
On a four-hour chart, the price is above the indicator lines. The Marlin oscillator is in the declining zone, but in the current situation, this is interpreted as a discharge of the indicator before further growth. The support of the MACD line at the price of 0.6840 coincides with the linear support levels on the daily chart.
The material has been provided by InstaForex Company – www.instaforex.com