Previous Story
Forecast for NZD/USD on March 5, 2019
NZD/USD
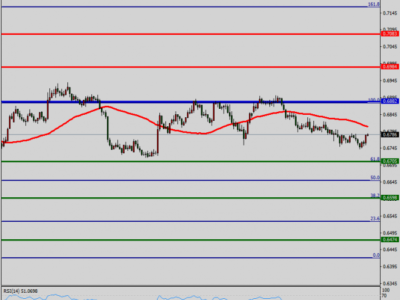
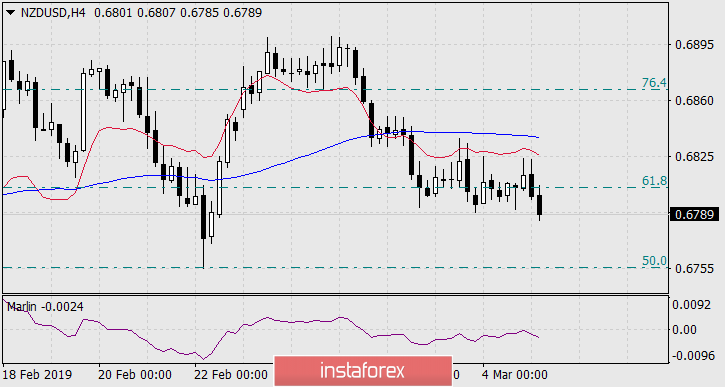
In the past two days, the New Zealand dollar lingered in a decline at the Fibonacci retracement level of 61.8% (also on the balance line of the daily timeframe, which breaks down today). The signal line of the Marlin oscillator of the daily chart is already in the trend decline zone.
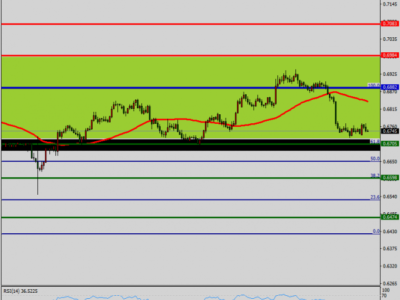
On the H4 chart, the price was trading in the sideways under the balance and Krusenstern lines during these two days, the Marlin indicator was in the negative zone, and at the moment it is still in it. We are waiting for the kiwi to further decline towards the target level of 0.6704 – the Fibonacci level of 38.2%, coinciding with the lows of January 22 and November 12. The second target is the 23.6% Fibonacci level on the 0.6646 stage.
The material has been provided by InstaForex Company – www.instaforex.com