
Previous Story
Friday 1st May: Daily technical outlook and review (European banks will be closed today in observance of Labor Day).
Posted On 01 May 2015
Comment: 0
EUR/USD:
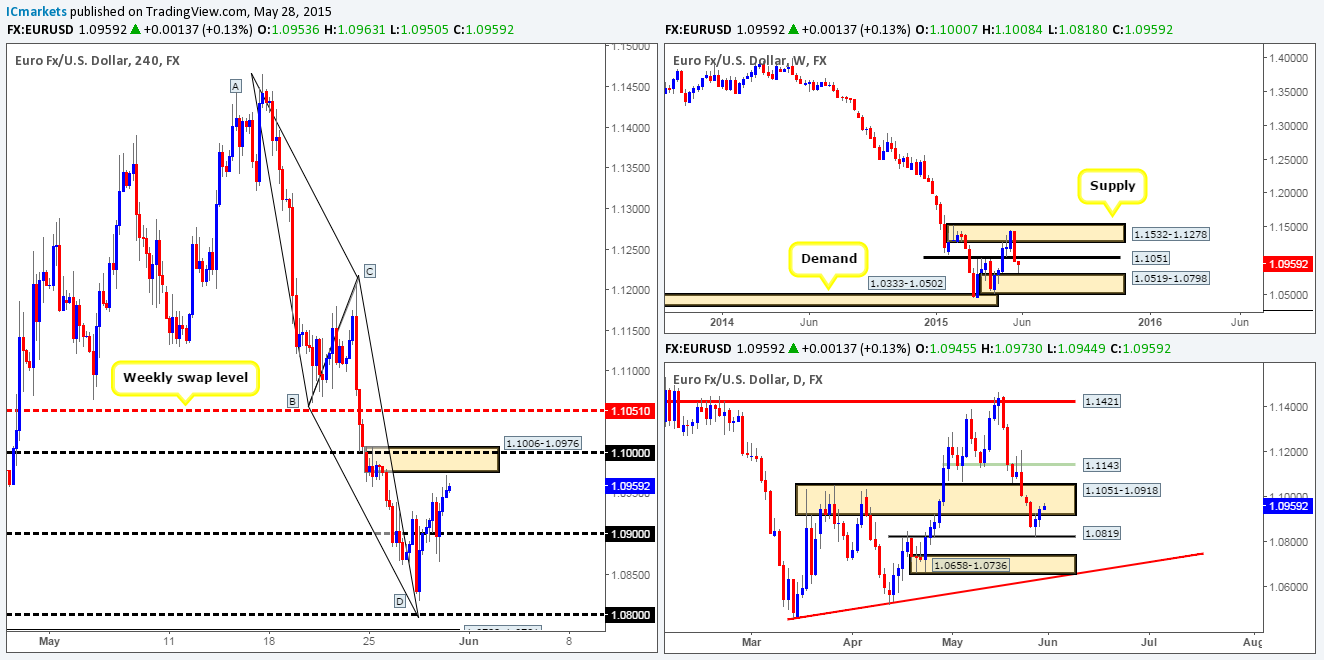
Weekly view: From the weekly scale, we can see that the weekly candle is currently trading below a very significant weekly supply area at 1.1449-1.1278. This has been the most we’ve seen the Euro rally since price began its descent back in May 2014. In spite of this, our long-term bias still remains south and will continue to do so until we see a convincing push above the aforementioned weekly supply area.
Daily view: Yesterday’s daily candle shows that price retested the recently-broken weekly swap level at 1.1096, and managed to break above the daily supply area seen at 1.1244-1.1158. This move has likely triggered buy stops from traders not only attempting to fade this area, but also from those looking to buy the breakout. As such, this has likely set the stage for the Euro to continue its advance north up to a daily Quasimodo resistance level coming in at 1.1421 (located deep within the aforementioned weekly supply area).
4hr view: After price met strong support at 1.1100 (located just above the aforementioned weekly swap level), the Euro aggressively rallied north, consequently closing above 1.1200. In the event that 1.1200 is retested as support during the upcoming sessions, and lower timeframe buying confirmation is seen, we’d confidently take an intraday long from here, targeting the 1.1280 4hr swap level. Our rationale behind this idea comes from the following:
- Price is trading just BELOW the weekly supply area at 1.1449-1.1278, so there’s still room to move north.
- The daily scale shows price has likely consumed a ton of stops above daily supply at 1.1244-1.1158, thus potentially opening the gates for further upside.
- If 1.1200 holds as support, the reason for selecting the 4hr swap level 1.1280 as our take-profit target is simply because this barrier is positioned neatly within the current weekly supply area.
As a final point, most European banks will be closed today in observance of Labor Day; hence the European session may be less liquid than usual.
Our current buy/sell orders:
- Buy orders: 1.1200 [Tentative – confirmation required] (Predicative stop-loss orders seen at: dependent on where one confirms this level).
- Sell orders: Flat (Predicative stop-loss orders seen at: N/A).
GBP/USD:
Weekly view: The weekly timeframe reveals that price recently collided with a strong-looking weekly supply area coming in at 1.5551-1.5391. Similar to the Euro, this recent surge in buying has been the most we’ve seen the pound rally since price began aggressively selling off back in July 2014. Our bias still remains short on this pair, and will continue to do so until we see price convincingly close above this weekly supply area.
Daily view: Yesterday’s daily candle shows that price strongly rebounded from a daily Quasimodo resistance level seen at 1.5478 (located within the aforementioned weekly supply area), which consequently forced price to cross swords with a recently broken daily swap area seen at 1.5298-1.5208.
4hr view: The GBP/USD’s recent descent took out several technical 4hr levels, and only really saw any meaningful counterattack once prices hit the1.5330/1.5300 region.
From a technical perspective, Cable is in a tricky location at the moment. Granted, we do have clear downward pressure being seen from both the weekly and daily timeframes at the moment, but at the same time supportive pressure is potentially brewing on both the 4hr and daily timeframes (see above).
So, where does this leave us with regards to buying and selling today? Well, shorting this pair is out of the question for us until we see a close below 1.5300, since this would likely open the trapdoor to a potential move down towards 4hr demand at 1.5172-1.5211. Buying from the 1.5330/1.5300 region on the other hand, looks ‘ok’ for an intraday move up to 1.5400. The reason we only say ‘ok’ is simply because we’re concerned that the recent downward pressure from shorts on the higher timeframes (see above) may be too much for the bulls to handle here. That being the case, should anyone be looking to buy the pound around this area today, we’d recommend waiting for some sort of confirmation signal on the lower timeframes before committing to any buy positions here.
Our current buy/sell orders:
- Buy orders: 1.5330/1.5300 region [Tentative – confirmation required] (Predicative stop-loss orders seen at: dependent on where one confirms this level).
- Sell orders: Flat (Predicative stop-loss orders seen at: N/A).
AUD/USD:
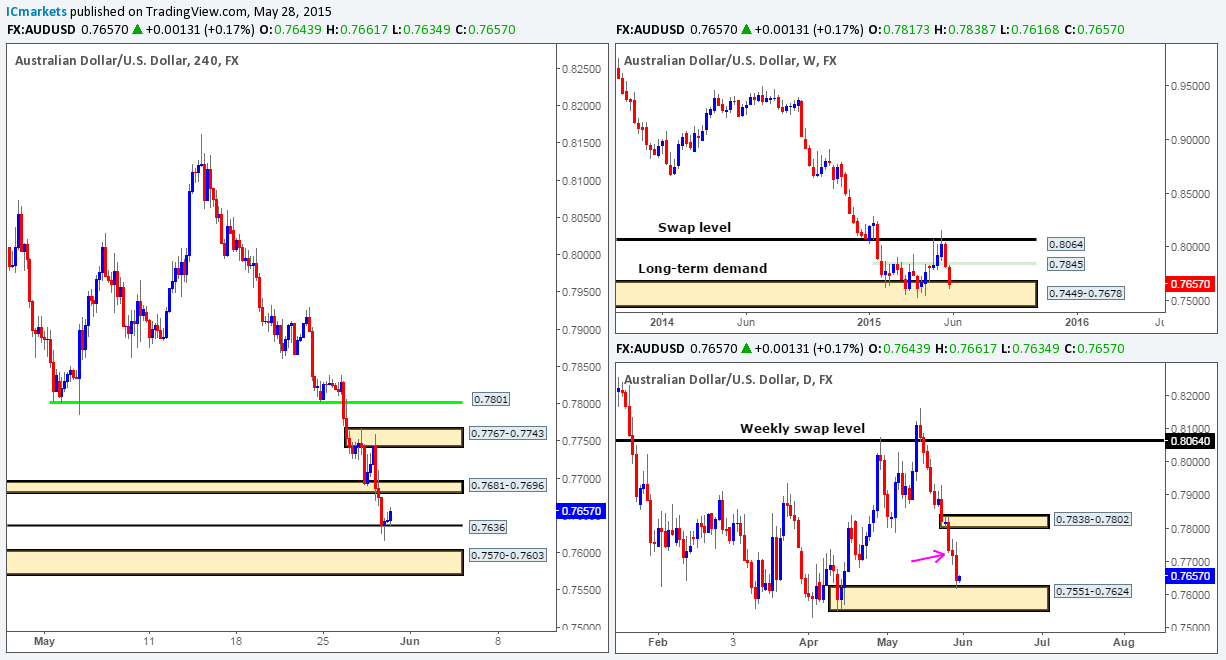
Weekly view: The weekly scale reveals that a beautiful to-the-pip reaction was recently seen from the weekly swap level coming in at 0.8064. This move could potentially inspire the sellers to continue pushing this market south and eventually challenge the weekly demand area seen at 0.7449-0.7678.
Daily view: The daily timeframe on the other hand, shows that price now shaking hands with a very obvious daily swap level coming in at 0.7875. In the event that a sustained move below this structure takes place, prices will likely be free to challenge the 0.7691 level, which, if you look back to the weekly chart, you’ll see is located only a few pips above the aforementioned weekly demand area.
4hr view: The recent descent on this pair managed to take out both 0.8000 and 0.7900, and only really saw buying interest once price collided with a clear area of 4hr demand seen at 0.7832-0.7862 (located just below the daily swap level mentioned above at 0.7875).
The bounce seen from the current 4hr demand zone looks promising, but the only way to know if the buying here was genuine and not just traders liquidating shorts, would be to see a convincing break above 0.7900. Until this happens though, our team has no interest in buying this pair. It has also been noted that shorting this market will not be permitted until we see a strong daily close below the aforementioned daily swap level.
Our current buy/sell orders:
- Buy orders: Flat (Predicative stop-loss orders seen at: N/A).
- Sell orders: Flat (Predicative stop-loss orders seen at: N/A).
USD/JPY:
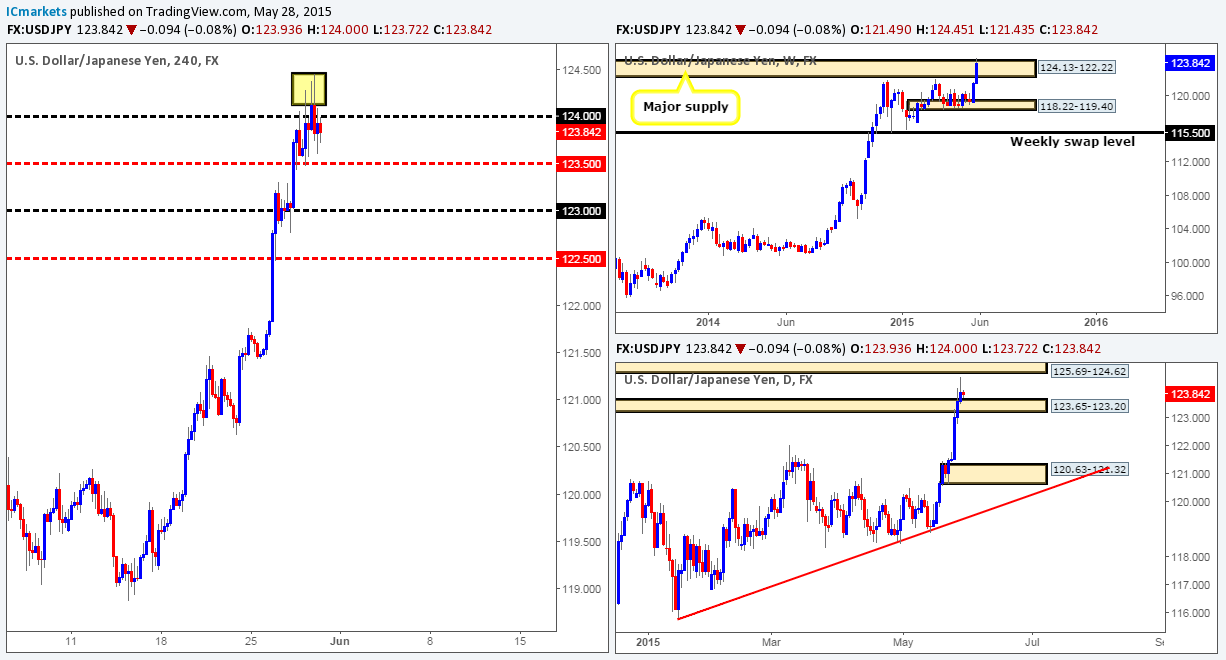
Weekly view: For the past month and a half, the buyers and sellers have been seen battling for position within a weekly demand area coming in at 118.22-119.40. Our long-term bias will remain north on this pair as long as price continues to trade above the weekly swap level seen below this area at 115.50.
Daily view: From the daily scale, we can see that price rebounded from a daily trendline extended from the low 115.55, which as you can see converges beautifully with daily support coming in just below it at 118.62 (located deep within the aforementioned weekly demand area). Yesterday’s high 119.88 likely took out the majority of the sellers seen around minor daily supply at 120.08-119.55, potentially clearing the path north for a move towards the daily Quasimodo resistance level seen at 120.35.
4hr view: Following on from yesterday’s report, our long position taken from the base of the bullish 4hr Harmonic Butterfly pattern (118.67/118.58) at 118.64 was closed for a small profit early on in the Asian session – well done to anyone who managed to remain long from here.
The recent influx of buyers saw price springboard itself over 140 pips straight into the jaws of a 4hr supply area coming in at 120.07-119.89, which, as you can see, was clearly enough to support a counterattack back down to a 4hr swap area at 119.35-119.19. In view of the higher-timeframes current position (see above), our attention will be mostly driven to longs today, in specific; the 4hr swap area just mentioned above at 119.35-119.19. On the condition that lower timeframe buying confirmation is seen around this 4hr zone today, our team would consider an intraday long position from here, targeting both 119.60 and 119.88.
Our current buy/sell orders:
- Buy orders: 119.35-119.19 [Tentative – confirmation required] (Predicative stop-loss orders seen at: 119.16).
- Sell orders: Flat (Predicative stop-loss orders seen at: N/A).
USD/CAD:
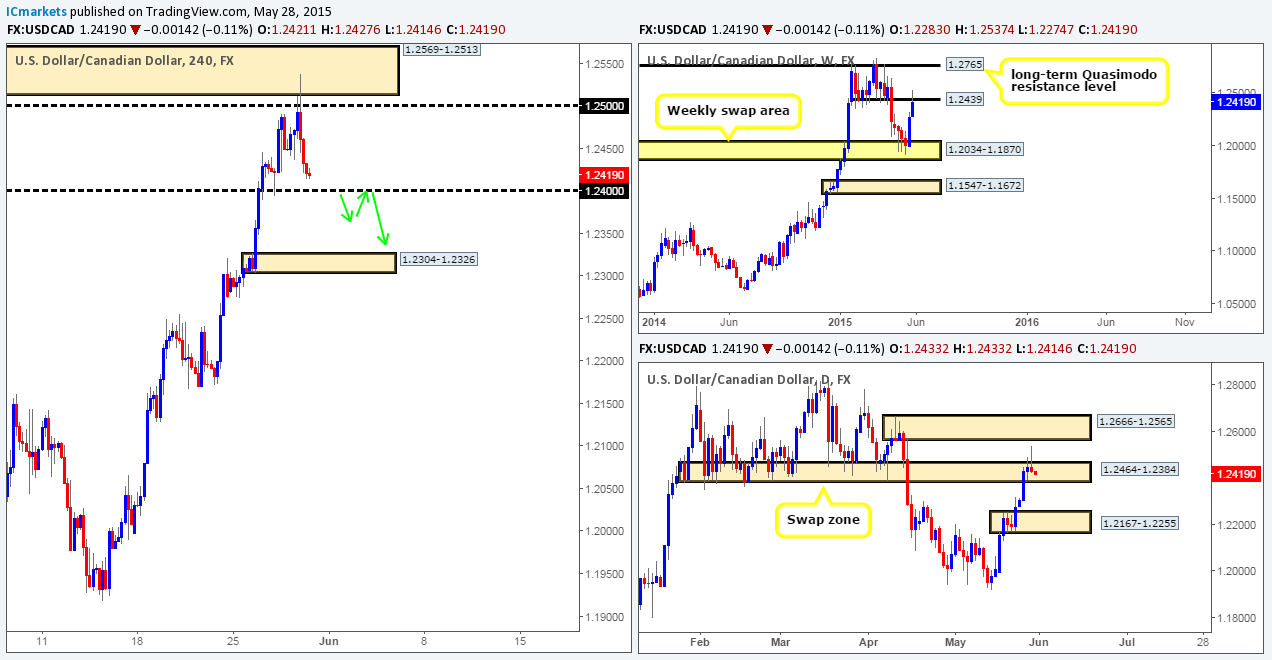
Weekly view: Following the weekly indecision candle that printed last week within the weekly swap area at 1.2265-1.2092, selling is currently being seen on the weekly timeframe. Should we see prices close below this weekly swap area, the path south will then likely be clear towards a weekly swap level seen at 1.1814.
Daily view: From the daily scale, we can see price is now firmly trading from daily demand at 1.1931-1.2045, which also boasts additional support from a Harmonic bullish Bat pattern completing just below at 1.1921. However, we will not be convinced that this is genuine buying until price closes above the daily swap level 1.2086. It will be interesting to see what the 4hr timeframe has to say about this…
4hr view: Amid yesterday’s sessions, specifically the European session, 4hr action shows that price retested the 1.2000/1.2014 area perfectly, and rallied higher. This move, as you can probably see, aggressively broke above both the round number 1.2100 and a 4hr supply area at 1.2116-1.2095, potentially freeing the path north up to 4hr supply at 1.2176-1.2147.
Taking all of the above on board, the green zone (1.2033/1.1995) is an area we believe to be the most logical place to look for buys today. Within it contains the 4hr swap level 1.2014, the round number 1.2000 and in addition to this, this is where we believe pro money made the decision to push above the aforementioned 4hr supply area, hence there could very well be unfilled buy orders still lurking within this zone. Take-profit targets will be dependent on how price approaches this buy zone. That being said, we would advise keeping your targets close, and treat this as a ‘scalp and see’ type of trade, since we are yet to see any confirmed buying on the weekly and daily timeframes (see above).
Our current buy/sell orders:
- Buy orders: 1.2033/1.1995 [Tentative – confirmation required] (Predicative stop-loss orders seen at: 1.1989).
- Sell orders: Flat (Predicative stop-loss orders seen at: N/A).
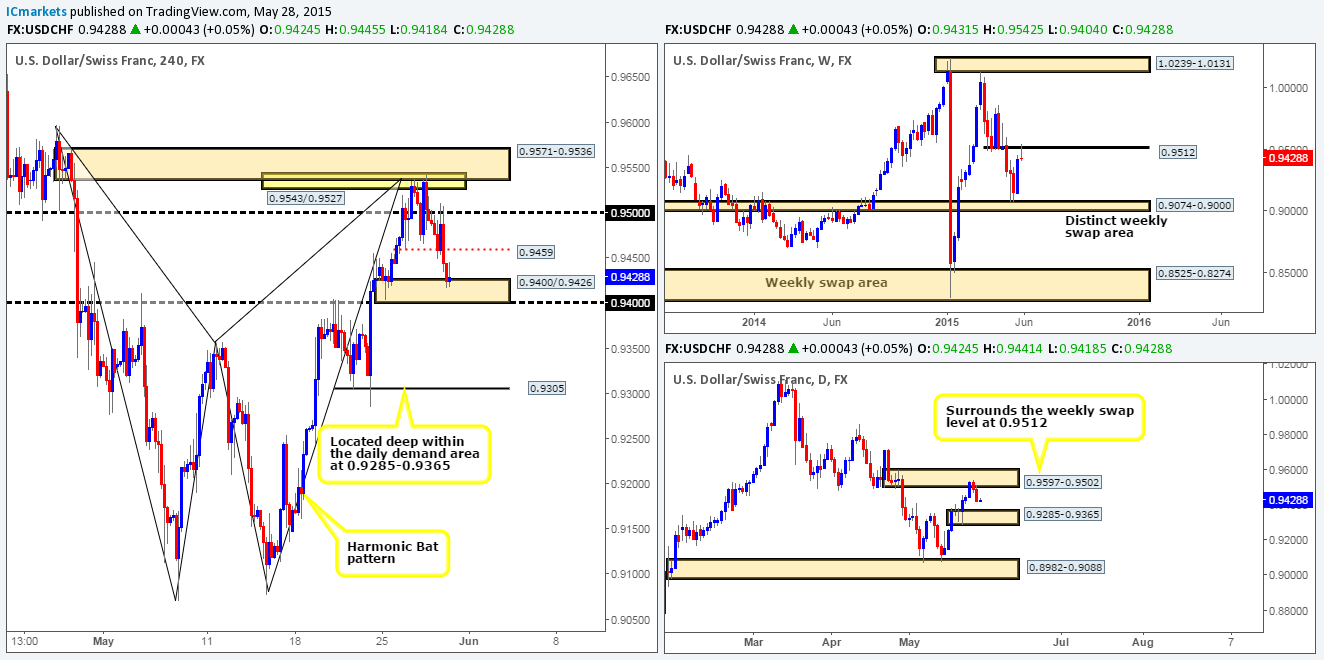
USD/CHF:
Weekly view: From the weekly scale, we can see that the weekly support level 0.9512 was recently breached. This move consequently saw the USD/CHF slam dunk itself into a strong-looking weekly demand area coming in at 0.9170-0.9343.
Daily view: The recent selling seen on this pair has placed price firmly within the jaws of a daily demand area seen at 0.9267-0.9334, which, if you look back to the weekly chart, you’ll see is located just within the aforementioned weekly demand area.
4hr view: The 4hr timeframe shows that the resistive pressure around the 0.9400 number was clearly too much for the buyers to contend with. This resulted in a sell off taking place, consequently spiking below the current 4hr demand area at 0.9313-0.9357.
Overall, from the weekly down to the 4hr timeframe this market is in clear demand (see above). However, if buyers fail to make an appearance above the 0.9300 region, then we believe there’s a strong possibility prices will decline all the way down to the 0.9165 mark. Why that far? Well, take a look below the 0.9300 number; can you see the clear demand consumption tails to the left at: 0.9285/0.9267/0.9255/0.9228/0.9194? These tails suggest to us that demand has already been consumed, thus price could very easily drop down to the next active 4hr support level which happens to be the 0.9165 level (positioned deep within the weekly demand area mentioned above at 0.9170-0.9343).
Therefore, we’re going to spend today watching price action between the 4hr demand at 0.9313-0.9357 and the round number 0.9300. In the event a lower timeframe buy signal is seen here, we’ll take a position and likely look to ride it up to 0.9400 to take partial profits. Ideally though, we’d love to see a close above this number as the move from here could then be huge.
Our current buy/sell orders:
- Buy orders: Watching price action for lower timeframe buying confirmation between 0.9357 and 0.9300 (Predicative stop-loss orders seen at: dependent on where one confirms this level).
- Sell orders: Flat (Predicative stop-loss orders seen at: N/A).
US 30:
Weekly view: Although the overall trend has been strong since early 2009, a temporary ‘ceiling’ to this index has formed around the 18098 region, and has remained strong for an impressive four months!
Daily view: From the pits of the daily scale, we can see that selling interest came into the market yesterday from daily supply at 18207-18117. As a result, this forced price to aggressively test the daily trendline support extended from the low 17033.
4hr view: (As mentioned in the previous analysis, the DOW has been forming what we believe to be a long-term 4hr bullish pennant formation – upper trendline extends from the 18279 high, while the lower line was drawn from the 17556 low).
As you can see, the recent sell off has closed prices below the ascending 4hr trendline that forms the lower limit of the 4hr pennant triangle pattern, and as a result, aggressively hit and rebounded from 4hr support seen just below it at 17817. In our opinion, the current 4hr pennant triangle formation is still intact; therefore, coupled with price presently teasing a daily trendline at the minute (see above), the 17817/17880 area could very well be a nice place to begin looking for intraday longs today up to around the 17980 mark. Nonetheless, by entering long here, you are potentially challenging higher-timeframe opposition from the current weekly resistance area 18098, so waiting for the lower timeframes to prove there is buying interest at this 4hr trendline extreme is probably the best path to take.

Our current buy/sell orders:
- Buy orders: 17817/17880 [Tentative – confirmation required] (Predicative stop-loss orders seen at: dependent on where one confirms this area).
- Sell orders: Flat (Predicative stop-loss orders seen at: N/A).
XAU/USD (Gold)
Weekly view: From a weekly timeframe perspective, the trend on Gold is still firmly south in our opinion, and will only change if price closes above the weekly trendline extended from the high 1488.0. Presently though, we can see that the buyers and sellers are still pulling for position just below weekly supply coming in at 1223.1-1202.6.
Daily view: The daily timeframe on the other hand, shows that price is currently testing a daily demand area at 1178.3-1185.8 for the third time. Assuming there is little buying interest at this zone, it’s likely we could see prices decline in value towards daily demand at 1159.4-1170.8, which is located just within weekly demand at 1130.1-1168.6.
4hr view: The Gold markets fell during yesterday’s sessions, completely wiping out any gains the market picked this week. Consequent to this, price tested 4hr demand at 1175.1-1178.9, which as you can see, also boasts nice-looking 4hr trendline convergence from the low 1142.5.
The bounce seen from the 4hr demand area does look promising, but the only way to know if the buying from here was genuine, and not just traders short-covering would be to see lower timeframe buying strength come into the market. This is extremely important, since let’s not forget where price is trading on the weekly timeframe (see above) at the moment. At this point in time, however, we have not seen anything on the 5 or 15 minute timeframes suggesting bullish strength is present in the market.
In the event that prices continue to sell off today, and manages to get below this area of 4hr demand, keep a close eye on price as we may see further downside towards the 4hr demand area coming in at 1168.6-1170.8 (located just within daily demand at 1159.4-1170.8).

Our current buy/sell orders:
- Buy orders: Watching for lower timeframe confirmation above 4hr demand 1175.1-1178.9 (Predicative stop-loss orders seen at: dependent on where one confirms this area)
- Sell orders: Flat (Predicative stop-loss orders seen at: N/A).
The post Friday 1st May: Daily technical outlook and review (European banks will be closed today in observance of Labor Day). appeared first on .


