Previous Story
Friday 24th April: Daily technical outlook and review.

EUR/USD:
Weekly view: The selling pressure which has been forcing the Euro south for nearly a year seems to be diminishing. Weekly demand at 1.0333-1.0502 has been able to hold this market higher since mid-March. As bullish as this sounds, our team will not be convinced the overall trend has changed until we see price convincingly push above weekly supply at 1.1449-1.1278.
Daily view: Price appears to be hesitating in no-man’s-land between a daily resistance zone at 1.1051-1.0918 and a daily demand area at 1.0461-1.0565 (a prior reaction to the aforementioned weekly demand zone).
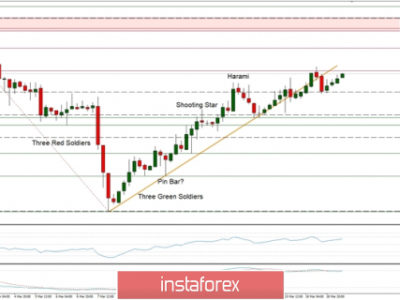
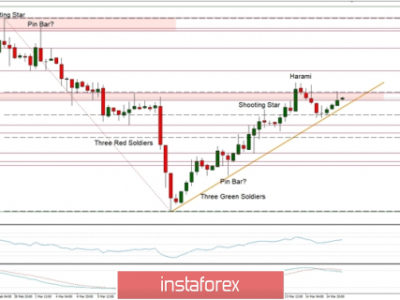
4hr view: Yesterday’s sessions saw price fake below round-number support at 1.0700 and rebound beautifully from a fresh 4hr demand coming in at 1.0658-1.0681. Big players were clearly interested in this zone since the Euro witnessed a 150-pip rally, consequently taking out both the round number 1.0800 and a 4hr Quasimodo resistance line at 1.0816.
As we can see, selling pressure is beginning to come into the market, a beautiful-looking 4hr bearish pin-bar candle recently formed around last Friday’s high 1.0847 seen marked with a green circle. Ok, so with price now hovering above a recently broken 4hr Quasimodo level and a round number, we’re looking for these two levels to form a structural supportive base today (green box). In the event that this area holds and we see lower-timeframe buying strength forming, our team would consider entering long here. Should we find an entry here today, we’re going to be watching for price to close above last Friday’s high; this will give us support and allow us to move our stop to breakeven. The ultimate take-profit zone comes in at 4hr supply seen above at 1.0953-1.0922 (located within daily supply at 1.1051-1.0918). This area also has a potential Harmonic Gartley reversal zone – the 0.786 retracement being the lower pink line at 1.0916, and the AB=CD completion positioned at the upper pink line at 1.0985.
Current buy/sell orders:
- Buy orders: 1.0816/1.0800 [Tentative – confirmation required] (1.0790).
- Sell orders: Flat (Predicative stop-loss orders seen at: N/A).
GBP/USD:
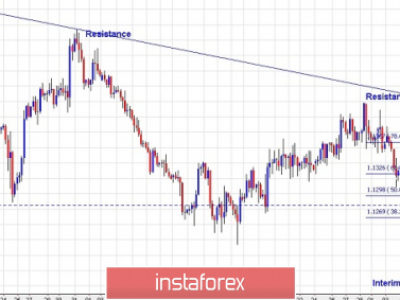
Weekly view: The weekly timeframe shows that the pound is beginning to poke its head above the weekly swap level 1.4989. A weekly close above this number would likely suggest a more bullish bias going into next week. It will be interesting to see what the lower timeframes have to say about this…
Daily view: Following Wednesday’s daily close above the aforementioned weekly swap level, yesterday’s action saw price respect this level as support. As long as the buyers can continue to defend this level, we see very little stopping Cable increasing in value. The reason for why is simply because of the wick seen to the left marked with a green arrow at 1.5164 resembles what we believe to be supply consumption, thus adding further confirmation a potential rally higher may be in store.
4hr view: From the 4hr timeframe, we can see price eventually respected the 1.5000 handle, we do hope some of our readers managed to lock in a position here (1.5000 was mentioned as a level to watch in the previous analysis). The bounce seen from 1.5000 does look promising, but the only way to know if buying interest remains strong would be to see a break above Wednesday’s high at 1.5078. This would then likely open the doors for prices to challenge the 1.5100 handle.
Given that both the weekly and daily charts (see above) are suggesting higher prices may be brewing, the 4hr timeframe shows it may be best to wait for prices to close above the 4hr Quasimodo resistance level at 1.5136 before considering medium-term buy positions. Therefore, with all of the above taken into consideration, and seeing how it’s the last trading day of the week, we’re going to take a back seat on this pair and patiently watch how price action develops.
Current buy/sell orders:
- Buy orders: Flat (Predicative stop-loss orders seen at: N/A).
- Sell orders: Flat (Predicative stop-loss orders seen at: N/A).
AUD/USD:
Weekly view: For the past three months or so, the weekly timeframe shows that the buyers and sellers have been battling for position around a weekly demand area seen at 0.7449-0.7678.
Daily view: Price action on the daily scale still shows price holding above the mid-range daily swap level at 0.7691. In the event that the buyers can maintain a strong position above this barrier, there’s a chance we may see prices challenge the upper range boundary seen at 0.7875.
4hr view: After meeting strong buying pressure from within 4hr demand at 0.7703-0.7719 yesterday, the Aussie witnessed an aggressive boost of buying energy. This move took prices up to a very minor 4hr supply area seen marked with a green circle at 0.7806-0.7776, which as you can see, lines up nicely with 0.7800.
We have no interest in selling here, in fact, due to where price is located on the higher-timeframes (see above), we’re actually looking for price to strongly close above the 0.7800 handle today. Why would we want to see that? Well, just above 0.7800, there is what we believe to be consumed supply – take note of the consumption wicks seen marked with black arrows at 0.7806/0.7825. Therefore, a close above 0.7800 would likely mean the runway north is potentially resistance free up to a very interesting area of 4hr supply coming in at 0.7883-0.7852 seen marked in green. This area, as you can probably see, coincides beautifully with not only a Harmonic Bat potential reversal zone (0.7882/0.7853), but also the aforementioned daily resistance barrier at 0.7875.
So, to sum up, a close above 0.7800 would, in effect, be our cue to begin watching for price to retest this number as support. Should an entry be seen, we’ll look to take profit around the 0.7850 mark.

Current buy/sell orders:
- Buy orders: Flat (Predicative stop-loss orders seen at: N/A).
- Sell orders: Flat (Predicative stop-loss orders seen at: N/A).
USD/JPY:
Weekly view: For the past month or so, the buyers and sellers have been seen battling for position within a weekly demand area coming in at 118.22-119.40. A break below this barrier will likely see prices collide with the swing low 116.86.
Daily view: The daily scale shows that selling interest came into the market yesterday, just missing the daily Quasimodo resistance level at 120.35 by a close 25-30 pips.
4hr view: Yesterday’s sessions saw the USD/JPY pair sell off from the 120.00 region. This move, as you can see, eventually took out 119.69 support and slammed into 4hr demand coming in at 119.33-119.44. If today’s action sees price close above 119.96 – now resistance, a potential intraday buying opportunity may unfold, targeting the 120.00 area.
Given that price is loitering within weekly demand at present, and room for the market to appreciate being seen on the daily scale up to at least the aforementioned daily Quasimodo resistance level (see above), our team has come to a general consensus that 119.69 is key today. A close above this level will be our cue to begin watching for price to retest this number as support. Should a retest happen along with supporting lower timeframe buying confirmation, a long position will likely be taken with 119.95 as our take-profit target.

Current buy/sell orders:
- Buy orders: Flat (Predicative stop-loss orders seen at: N/A).
- Sell orders: Flat (Predicative stop-loss orders seen at: N/A).
USD/CAD:
Weekly view: From the weekly scale, we can see that price continues to show bearish intentions as price continues to extend lower from the initial reaction seen at the weekly Quasimodo resistance level at 1.2765. This could continue for a little while yet as weekly support is not expected to come into the market until around the 1.1814 point.
Daily view: The rebound seen from the daily swap level at 1.2083 appears short-lived, downward pressure came into the market from an almost invisible area of daily supply seen at 1.2326-1.2279.
4hr view: The latest coming in from the 4hr timeframe shows that the USD/CAD aggressively sold off, taking out 1.2217 and 1.2200 before finally hitting and closing below the 4hr Quasimodo support level 1.2142.
In our opinion, the next move on this pair depends on where the next 4hr candle closes. Say price closes below the 4hr Quasimodo line once again, this, at least for us anyway, would likely suggest a more bearish tone for the day and see prices fall towards daily support at 1.2083. On the other hand, a close above this level suggests strength, opening up the gates for potential intraday buying up to around the 1.2200 region. Ultimately though, we’d much prefer to see a close lower. The reason being is simply because the weekly timeframe is currently bearish, and at the same time there’s room on the daily chart to move lower (see above).
Therefore, to sum up, intraday longs with confirmation will be taken should a close above 1.2142 be seen, with 1.2190 in mind as a profit target. Conversely, a close lower would be a signal to begin watching the lower timeframes for selling strength, should an entry be seen, we’ll then look to trail this beast down to around the 1.2087 mark, just above the aforementioned daily support level.

Current buy/sell orders:
- Buy orders: Flat (Predicative stop-loss orders seen at: N/A).
- Sell orders: Flat (Predicative stop-loss orders seen at: N/A).
USD/CHF:
Weekly view: For the past month, weekly support has been seen forming around the 0.9512 region. This market clearly likes this level at the moment. A break below this number would likely encourage market participants to push prices down towards a weekly demand area seen at 0.9170-0.9343.
Daily view: From this angle, it is clear a consolidation zone is currently being chiseled out above the aforementioned weekly support level. Upper limits are seen in the form of a daily supply area at 0.9904-0.9771; the lower limits represent a daily demand zone coming in at 0.9449-0.9545. The recent selling has placed current action within the lower limit, so for anyone presently short this pair may want to take a note of this.
4hr view: During the course of yesterday’s sessions the USD/CHF witnessed a sharp decline in value of around 150 pips, completely wiping out any gains the market picked up on Wednesday. After absolutely obliterating the 0.9600 handle, buying interest is now beginning to form around a 4hr demand area seen at 0.9499-0.9541.
Considering the market’s overall position at the moment (see above), the outlook for the Swiss pair is currently long. With that in mind, our team has already executed a trade at 0.9543, which as you can probably see, is located a pip or two above the aforementioned 4hr demand area. First take-profit target comes in at the round number 0.9600, should we manage to get above this level, and we’ll then be looking towards 0.9700.

Current buy/sell orders:
- Buy orders: 0.9543 [Live] (Predicative stop-loss orders seen at: 0.9492).
- Sell orders: Flat (Predicative stop-loss orders seen at: N/A).
US 30:
Weekly view: Although the overall trend has been strong since early 2009, a temporary ‘ceiling’ to this index formed around the 18098 region, which as you can probably see, has been able to hold price lower for the past four months now!
Daily view: Since the beginning of the week, price has been tackling the underside of daily supply at 18207-18117. A break above this beast would likely encourage the six-year long uptrend to continue. On the flip side, should selling be seen here today, the most we see prices dropping to is the daily trendline support extended from the low 17033.
4hr view: The current status of the 4hr timeframe shows price is compressing – forming a long-term 4hr bullish pennant formation (to see the full structure, please minimize the chart). When we spoke about this yesterday, price was loitering around the 18000 mark, essentially mid-range. Yesterday’s buying, however, forced price to test the upper extremes of this pattern, which converges nicely with 18110 4hr Quasimodo resistance. Unfortunately though, we were not at our desks to take this trade, well done to anyone who managed to lock in a position here!
Today’s trading may see price retest the upper 4hr pennant extreme again if support holds at 18053-18023, which could effectively give us a second chance to enter short. In the event that this 4hr area gives way, intraday shorts may be possible for us if price retest this zone as supply, and shows corresponding lower timeframe confirmation. Should this play out, we’ll look to take profit around 4hr demand at 17898-17949.

Current buy/sell orders:
- Buy orders: 17817 [Tentative – confirmation required] (Predicative stop-loss orders seen at: dependent on where one confirms this level).
- Sell orders: Flat (Predicative stop-loss orders seen at: N/A).
XAU/USD (Gold):
Weekly view: From the weekly scale, we can clearly see selling interest forming around weekly supply at 1223.1-1202.6. Assuming that this selling interest continues, we might, just might, see prices challenge the weekly demand area below coming in at 1130.1-1168.6.
Daily view: The daily timeframe on the other hand, shows that price rebounded from a daily demand area at 1178.3-1185.8 yesterday. This area, as far as we can see, remains a key obstacle to a move down towards daily demand seen at 1159.4-1170.8 (located just within the aforementioned weekly demand area)
4hr view: Gold witnessed a decent-sized rally from 4hr demand coming in at 1183.8-1188.5, which, as you can see, took prices up to a small 4hr supply zone at 1198.9-1197.5. Given that price is currently trading between these two 4hr areas at the moment, we have no interest whatsoever in trading Gold right now.
In the event that price revisits either of these two areas today, however, one could look to trade. That being said, we would advise caution here and highly recommend waiting for confirming strength to be seen on the lower-timeframe structures before risking capital. Why? Well, the 4hr demand area took a whopping great blow, see how deep price drove into this zone; this move likely consumed a ton of buyers, and as a result has very likely weakened the area. With regards to the small 4hr supply area, granted, this zone was not tested to its extremes; but quite frankly, this area is so small, it’s just begging to be faked/spiked.
Should we see a break below the current 4hr demand sometime today; all eyes will be on the 4hr level below it at 1182.5. Check out how violently price moved from this number, only pro money can do this, thus unfilled buy orders may still remain. A sharp rebound could be seen from here, so pending orders should be placed early. If you choose to wait for confirmation, like us, we’d suggest setting alerts, and if triggered, preparing all the lower timeframes clearly (1/3/5/15/) up on the screen so you can get an accurate read on the strength seen at this level.
A close above the small 4hr supply area on the other hand, will likely open the doors to intraday buying up to at least the high 1204.7. In the event this happens, buying the breakout is not our style; we’d much prefer to wait to see if price can successfully retest this level as support before taking the plunge.

Current buy/sell orders:
- Buy orders: 1183.8-1188.5 [Tentative – confirmation required] (Predicative stop-loss orders seen at: 1183.2) 1182.5 [Tentative – confirmation required] (Predicative stop-loss orders seen at: dependent on where one confirms this level)
- Sell orders: 1198.9-1197.5 [Tentative – confirmation required] (Predicative stop-loss orders seen at: 1199.3).
The post Friday 24th April: Daily technical outlook and review. appeared first on .
Source:: Friday 24th April: Daily technical outlook and review.