
Previous Story
Friday 28th November: Daily technical outlook and review.
Posted On 28 Nov 2014
Comment: 0
EUR/USD:
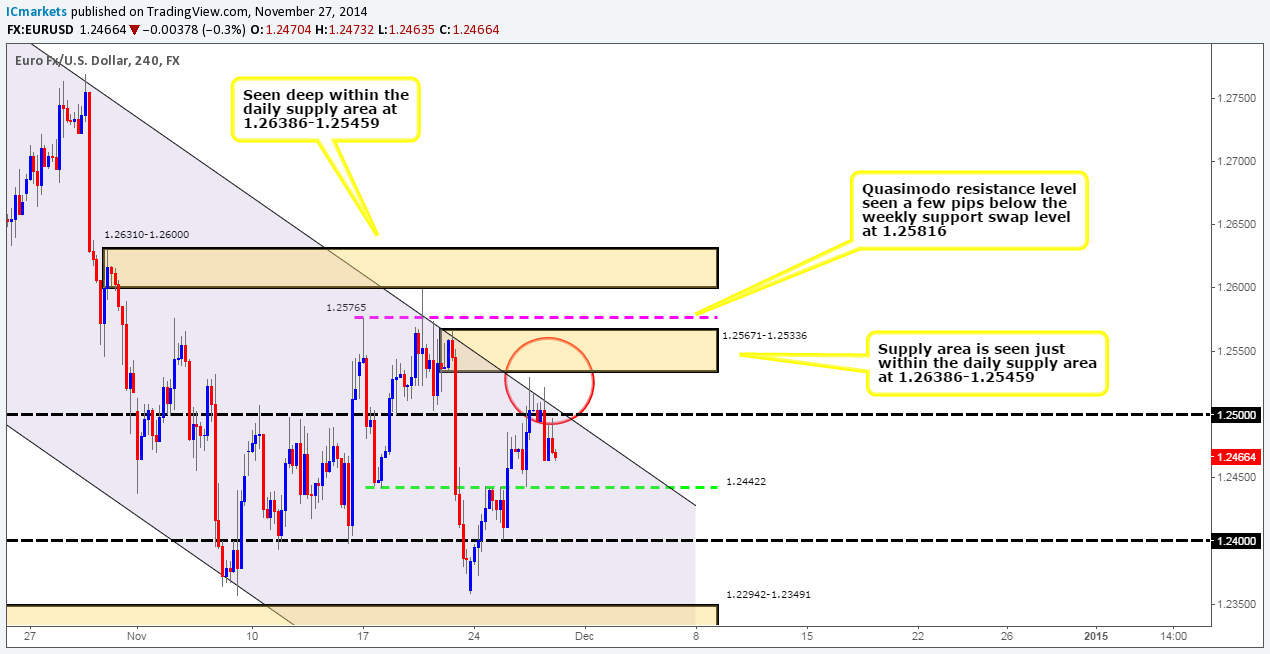
Weekly Timeframe: The weekly timeframe shows that price has been effectively trapped between a major combined weekly demand/Quasimodo support area at 1.22403-1.24420/1.22866, and a weekly support swap level coming in at 1.25816 for the past three weeks now.
Daily Timeframe: The daily timeframe shows the same as the weekly timeframe, only in more detail. Price is seen ranging between smaller daily supply and demand zones (1.26386-1.25459/1.22877-1.23809) within the aforementioned larger weekly areas. We would need to see a break above this range for us to begin looking at buying long/medium term positions on this pair. Let’s see what the 4hr timeframe has to say.
4hr Timeframe: The EUR/USD pair as you can see reacted well to 4hr resistance cluster seen marked with a red circle (1.25/downward channel resistance). We do hope some of our readers are took advantage of this move.
Where do we see price moving to today? No significant support is seen until 1.24422, so the Euro could indeed continue south. With that being said for anyone currently short, you should expect some buying opposition around this area. We are going to be watching this level closely around 1.24446 for an entry long with confirmation, and in all honesty we’d only be trading for a bounce up to the channel resistance. In the event that this 4hr support level is consumed, this would likely attract further selling down to 1.24, where again we’d be looking to enter with lower-timeframe confirmation around 1.24050.
The reason why we’re not placing any pending orders on this pair for the moment is simply because we have no higher timeframe direction. To put it another way – price is currently ranging on the higher timeframes, and we USUALLY avoid using pending orders in such market environments.
Buy/sell levels:
- Buy orders: 1.24446 [Tentative] (Predicative stop-loss orders seen at: Dependent on how one confirms this level) 1.24050 [Tentative] (Predicative stop-loss orders seen at: 1.23900).
- Sell orders: N/A (Predicative stop-loss orders seen at: N/A).
GBP/USD:
Weekly Timeframe: This week has shown that the buyers broke above a weekly resistance swap level coming in at 1.57166, but nonetheless seems to have found selling opposition around 1.58246. Let’s take a look on the lower timeframes to see what we can find.
Daily Timeframe: The reason for the selling pressure likely comes down to a daily supply area seen at 1.59438-1.58338. For higher prices to be seen on the pound, this area would need to be consumed. If the buyers can hold out above 1.57166 on this timeframe, this could be a signal that buying strength is entering the market.
4hr Timeframe: A nice bearish reaction was seen from the 4hr decision-point supply area at 1.58389-1.58103 (located just below the aforementioned daily supply area). We were clearly wrong not to be looking for shorts there!
As we can all see price is presently trading around a 4hr resistance swap area at 1.57208-1.56927, which surrounds the aforementioned weekly resistance swap level. We will be watching the lower timeframes around the 1.57263 area for some sort of buying confirmation that strength is entering the market. If this area fails, be prepared for acceleration to the downside towards at least the 4hr support area coming in at 1.55917-1.56299, where buying could potentially be seen again (tentative buy orders are seen within the support area at 1.56141). The reason why prices could drop this far is because we believe most of the demand to the left has already been consumed – check out the pink trendline, and the demand consumption tails that form it at 1.56781/1.56475/1.56274.
Buy/sell levels:
- Buy orders: 1.57263 [Tentative] (Predicative stop-loss orders seen at: 1.56876) 1.56141 [Tentative] (Predicative stop-loss orders seen at: 1.55634).
- Sell orders: N/A (Predicative stop-loss orders seen at: N/A).
AUD/USD:
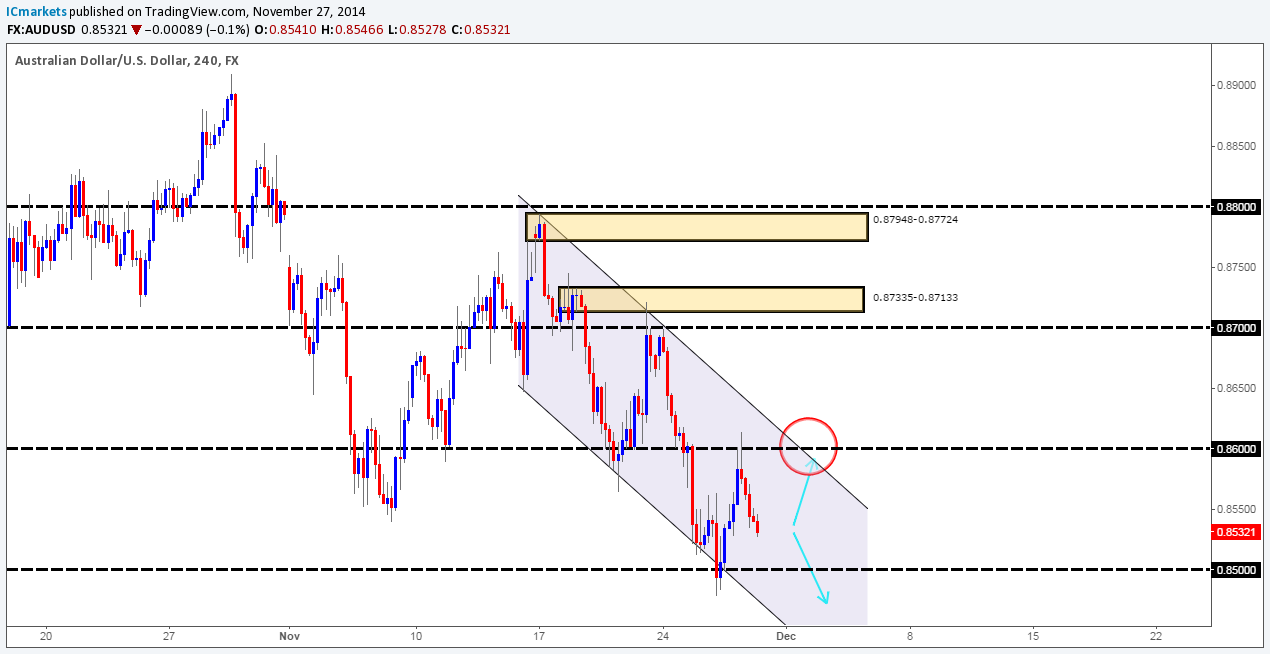
Weekly Timeframe: The weekly timeframe shows that price has been respecting the limits of a long-term down-trending channel (upper/lower limits – 0.97569/0.88468) for quite some time now. Recent trading action reveals that the sellers are currently attempting to break below the weekly Quasimodo support level coming in at 0.85769, which has been holding the market higher for three consecutive weeks now. In the event that further selling is seen here, price will likely hit a major weekly demand area seen just below at 0.80646-0.84601.
Daily Timeframe: The situation on the daily timeframe reveals that price closed below the 0.85769 level on Tuesday, and retested it as resistance yesterday. In the event that further selling is seen from here, we will likely see a test of the daily demand area seen below at 0.83147-0.84336 (located within the aforementioned weekly demand area). Let’s see what we can find on the 4hr timeframe.
4hr Timeframe: Unfortunately, we cannot view the 4hr timeframe historical price action since our data feed does not extend that far, so we will just work with what we have for now.
At the time of writing, we do not see any safe entries to sell at current price targeting the aforementioned daily demand area. The sellers would need to close below 0.85 to show us that the market has the potential to decline further. That being said though, if price were to return to the 0.86 level within the red circle, we would consider entering short with confirmation from the lower timeframes around 0.85962, since this has added confluence from the 4hr channel resistance (0.87948)
In a like manner, if prices close above this confluent area of resistance, we would see this as a sign of bullish strength, and begin looking for buying opportunities.
Buy/sell levels:
- Buy orders: N/A (Predicative stop-loss orders seen at: N/A).
- Sell orders: 0.85962 [Tentative] (Predicative stop-loss orders seen at: 0.86185).
USD/JPY:
Weekly Timeframe: Last week saw the USD/JPY pair advance to a fresh high of 118.968 as price continued on its relentless march north. This move consequently spiked above a major weekly supply area coming in at 117.931-116.799. Was this spike a fakeout to gather liquidity for lower prices, or a continuation move for a rally higher?
Daily timeframe: The daily timeframe still shows that this market is consolidating between a daily supply area coming in at 119.820-118.700 (seen just above the aforementioned weekly supply area), and a daily decision-point demand area coming in at 116.326-117.040. In our opinion, for the current weekly spike to be a fakeout, a break below this daily decision-point demand area would need to be seen. Equally, if price trades higher and consumes the daily supply area, we would know with a high probability that the market will likely continue north.
4hr Timeframe: The USD/JPY pair looks a right mess to us at the moment, we feel sorry for the traders who have been caught in the choppy action seen around 118.
(Very similar to our last report on this pair) For us to consider buying the USD/JPY pair again, price would have to break above 119 and successfully retest it as support. Conversely, selling is something we would not be comfortable with doing until the 4hr ignored Quasimodo resistance level seen at 116.814 (located within the aforementioned daily decision-point demand area) is consumed.
Therefore, until either of the above is seen, we are unfortunately forced to sit on the side lines for the time being.

Buy/sell levels:
- Buy orders: N/A (Predicative stop-loss orders seen at: N/A).
- Sell orders: N/A (Predicative stop-loss orders seen at: N/A).
EUR/GBP:
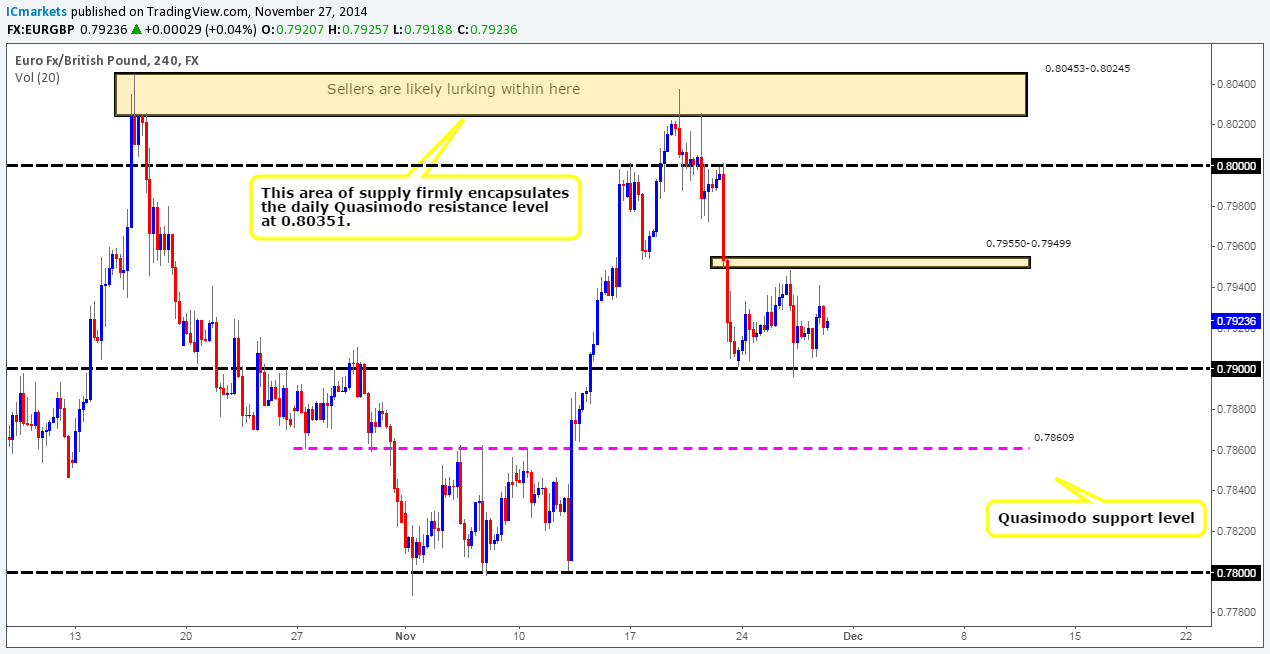
Weekly Timeframe: The weekly timeframe shows that price has been, and still remains to be consolidating between a weekly resistance level seen at 0.80328, and a major weekly demand area coming in at 0.76931-0.78623.
Daily Timeframe: The situation on the daily timeframe shows that the buyers are currently holding above an ignored daily supply area coming in at 0.79109-0.78917. In the event that this area fails to hold, further selling would likely see prices hit a daily demand area coming in at 0.78007-0.78336, which is conveniently located within the weekly demand area mentioned above at 0.76931-0.78623.
4hr Timeframe: We can see from the 4hr timeframe that the market is currently being held lower by a small, almost invisible 4hr decision-point supply area seen at 0.79550-0.79499. This is what we believe to be stopping prices moving higher off of the ignored daily supply area (see above).
Considering we have little to no direction on the weekly timeframe, and hesitant buyers on the daily timeframe, this remains a very hard market for us to trade in, unless of course you trade ranges, in which case this is dreamy price action with potential buys seen at 0.79026, and sells at 0.79479. However, we would advise anyone considering trading these levels to do so only with confirming price action from the lower timeframes, as consolidated areas such as this tend to be prone to fakeouts.
In our humble opinion, it would be best to wait for price to breakout and then look to trade the retest here, as the room both above and below the range is fantastic good risk/reward trades.
Buy/sell levels:
- Buy orders: 0.79026 [Tentative](Predicative stop-loss orders seen at: Dependent on where the level is confirmed).
- Sell orders: 0.79479 [Tentative] (Predicative stop-loss orders seen at: 0.79582).
USD/CAD:
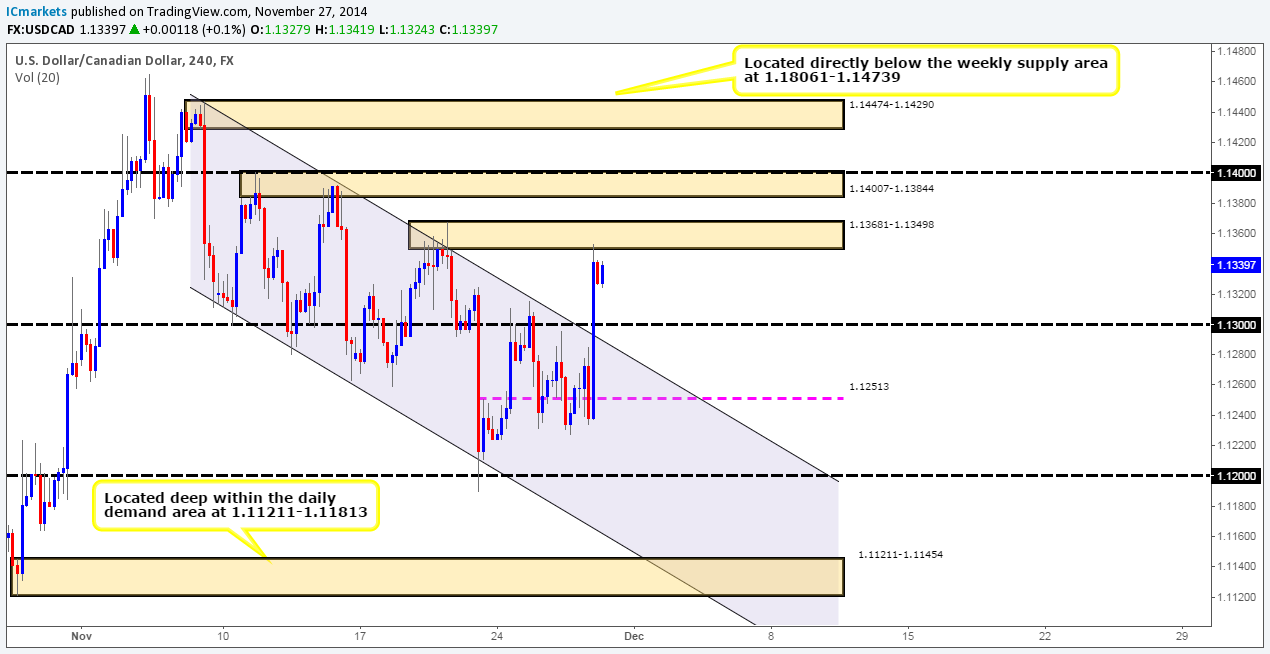
Weekly Timeframe: Price still remains trading below a major weekly supply area coming in at 1.18061-1.14739. As per this timeframe, it appears the path south is potentially clear down to at least 1.09394, since we believe most of the near-term demand has already likely been consumed – check out the demand consumption tails seen at 1.11211/1.10807. Let’s see what we can find on the lower timeframes.
Daily Timeframe: There was clearly serious buying interest in the market yesterday, which has resulted in prices being forced higher into a daily supply area seen at 1.13681-1.13024. In the event that this area of supply fails, the market will likely trade back up to the aforementioned weekly supply area, since we see only consumed supply directly above. Let’s take a look on the 4hr timeframe to see what we can find.
4hr Timeframe: The aggressive buying momentum seen yesterday has broken out of the down-trending channel up to a 4hr supply area coming in at 1.13681-1.13498 (located very deep within the aforementioned daily supply area). A break above this area could cause panic for any sellers. The reason why is that just above here we see a partially consumed 4hr supply area at 1.14007-1.13844, price could potentially trade straight through here towards a fresh area of 4hr supply coming in at 1.14474-1.14290 (located just below the aforementioned major weekly supply area).
In spite of this, we are still going to be watching price action around the current 4hr supply area for lower-timeframe confirmation sell opportunities, targeting at least 1.13.
On a side note, clearly our live sell position taken at 1.12979 has been stopped out now; it was only by a stroke of luck we took partial profits around 1.12570 just before the move higher ensued.
Buy/sell levels:
- Buy orders: N/A (Predicative stop-loss orders seen at: N/A).
- Sell orders: Currently watching lower-timeframe price action for entries short (Predicative stop-loss orders seen at: N/A).
USD/CHF:
Weekly Timeframe: For the past three weeks now, price has been stalling around a weekly supply area coming in at 0.98378-0.96993. In the event that active sellers enter the market here, we see very little stopping prices from declining down to at least 0.94546, a weekly resistance flip level.
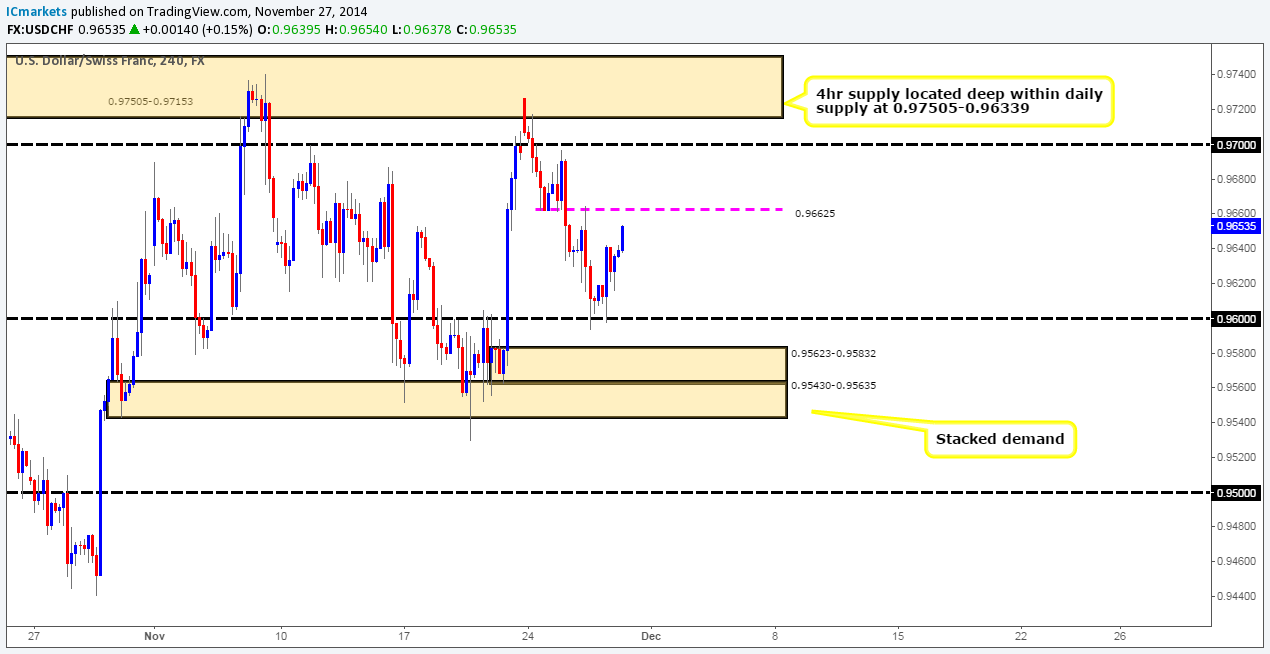
Daily Timeframe: The current situation on the daily timeframe shows that price is ranging between a major daily supply area at 0.97505-0.96339 (located within the aforementioned weekly supply area), and a small daily demand area seen at 0.95296-0.95998. Before the market can reach the aforementioned weekly resistance flip level, selling pressure must take out this daily demand area.
4hr Timeframe: The 4hr timeframe shows that selling was indeed seen down towards 0.96, where at which point active buyers entered the market. This could have made for a nice short-term entry long as price was effectively trading around the lower limits of the daily range (see above) then.
The bigger picture is telling us (at the time of writing) that price is dancing around a weekly supply area at the moment, while on the daily timeframe we can see price ranging, and it is only until price breaks this range, will we then have direction (for levels – see above). Therefore, with this in mind, trading without lower-timeframe confirmation on this pair may not be the best path to take.
At this point in time the only place we would consider entering this market is around the 4hr stacked demand area (0.95430-0.95635/0.95623-0.95832), since this is located deep within the daily demand area (0.95296-0.95998) that is holding the market higher at present. Sell orders COULD be present around 0.96603, just below a small 4hr support swap level at 0.96625 where there may be an opportunity to scalp the bounce. That being said though, we do not hold much confidence in this level, so trade safe. It will be interesting to see how price action unfolds in the later sessions.
Buy/sell levels:
- Buy orders: N/A (Predicative stop-loss orders seen at: N/A).
- Sell orders: 0.96603 (Predicative stop-loss orders seen at: 0.96706).
XAU/USD (GOLD):
Weekly Timeframe: The weekly timeframe shows that further buying was seen last week. This move gave us further cause to believe that the 1136.30 level is a solid area of demand. To the upside, there seems to be very little resistance in the way that could stop prices challenging 1244.08 again.
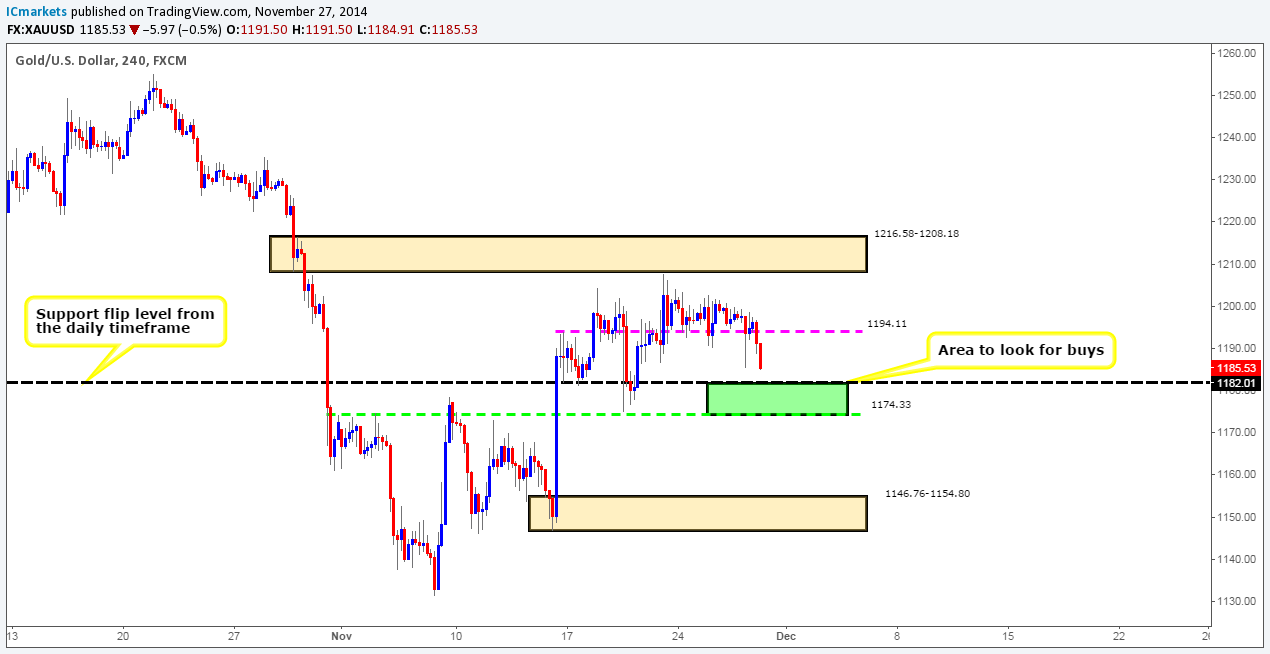
Daily Timeframe: The current situation on the daily timeframe clearly shows that sellers have entered the market. That being said though, our bias still remains long and will remain this way until price significantly closes below the major daily support swap level coming in at 1182.01.
4hr Timeframe: The 4hr timeframe reveals that price had indeed broken below the 1194.11 level, and as a result caused further selling to be seen.
An area we have eye on at the moment is seen marked in green between the daily support flip level mentioned above at 1182.01, and a minor 4hr resistance flip level coming in at 1174.33. In our opinion, this area provides a stable platform in which to begin looking for confirmed buying opportunities. We say confirmed here simply to avoid a fakeout, but if one had the risk appetite, they could possibly place a small pending buy order around 1183.11, and see how price reacts.
Buy/sell levels:
- Buy orders: 1183.11 (Predicative stop-loss orders seen at: 1172.67).
- Sell orders: N/A (Predicative stop-loss orders seen at: N/A).
Source:: Friday 28th November: Daily technical outlook and review.


