
Previous Story
Friday 8th May: Volatility is expected in the markets today as the NFP release takes center stage.

EUR/USD:
Weekly view: The weekly timeframe shows that selling interest is currently being seen from deep within a weekly supply area coming in at 1.1449-1.1278. The past two months have been the most we’ve seen the Euro rally since price began its descent back in May 2014. In spite of this, our long-term bias still remains south and will continue to do so until we see a convincing push above the aforementioned weekly supply area.
Daily view: A beautiful to-the-pip reaction has been seen from the Harmonic resistance zone (Bat pattern) coming in at 1.1516/1.1376. Assuming that follow-through selling is seen from here today, its likely prices could retest the combined weekly/daily swap area at 1.1096/ 1.1051-1.0918 once again.
4hr view: Prior to yesterday’s sell off, we can see that price faked above 4hr supply at 1.1387-1.1346, missing the psychological number 1.1400 by a mere 10 pips! From here the Euro proceeded to decline in value, effortlessly breaking through 1.1300 and testing 4hr demand coming in at 1.1207-1.1233. Given that price is currently trading from overall resistance on the higher timeframes at the moment (see above), we feel there’s a chance that the current 4hr demand area could struggle to hold during today’s sessions. In addition to this, we’re seeing temporary resistance form just above this area around the 1.1265 mark, which is holding firm despite price trading around demand. On the flip side, this 4hr demand area could potentially force the market into temporary consolidation between here and 1.1265 ahead of the mighty NFP announcement which is due to be released later on.
With everything take into consideration, our team has no interest in buying this market due to what the higher-timeframe picture is telling us (see above). Although selling would be more favorable from a daily and weekly technical standpoint, shorting into 4hr demand is just something we cannot condone. Therefore, we’ve opted to remain flat until at least after the NFP data has been released.
Levels to watch/live orders:
- Buys: Flat (Predicative stop-loss orders seen at: N/A).
- Sells: Flat (Predicative stop-loss orders seen at: N/A).
GBP/USD:
Weekly view: From this angle, we can see price is once again nibbling at the underside of weekly supply coming in at 1.5551-1.5391.
Daily view: The daily picture reveals price is aggressively advancing towards the daily Quasimodo resistance level seen at 1.5478, which if you look back to the weekly chart, you’ll notice that it’s located within the aforementioned weekly supply area.
4hr view: At 10.00pm GMT, the BBC exit poll was released. The conservative party led by incumbent Prime Minister David Cameron is believed to have won 316 seats in parliament and will likely form the next government in the UK. This, as you can see, saw the GBP rally aggressively against the U.S dollar taking out several technical levels along the way. However, it is only early days in this election and it could potentially be another 24 hours before we have any certainty.
From a technical standpoint, price is, at the time of writing battling to stay above 1.5400 after colliding with extreme highs coming in around the 1.5450 mid-level point. If price is seen holding above 1.5400, we may consider taking a long entry here provided that both a retest is seen and lower timeframe buying strength takes form. Granted, this will mean buying into higher-timeframe opposition (see above), but when volatile events take over the market, we’ve found its best not to try and attempt to fade this.
Levels to watch/ live orders:
- Buys: 1.5400 [Tentative – confirmation required] (Predicative stop-loss orders seen at: dependent on where one confirms this level).
- Sells: Flat (Predicative stop-loss orders seen at: N/A).
AUD/USD:
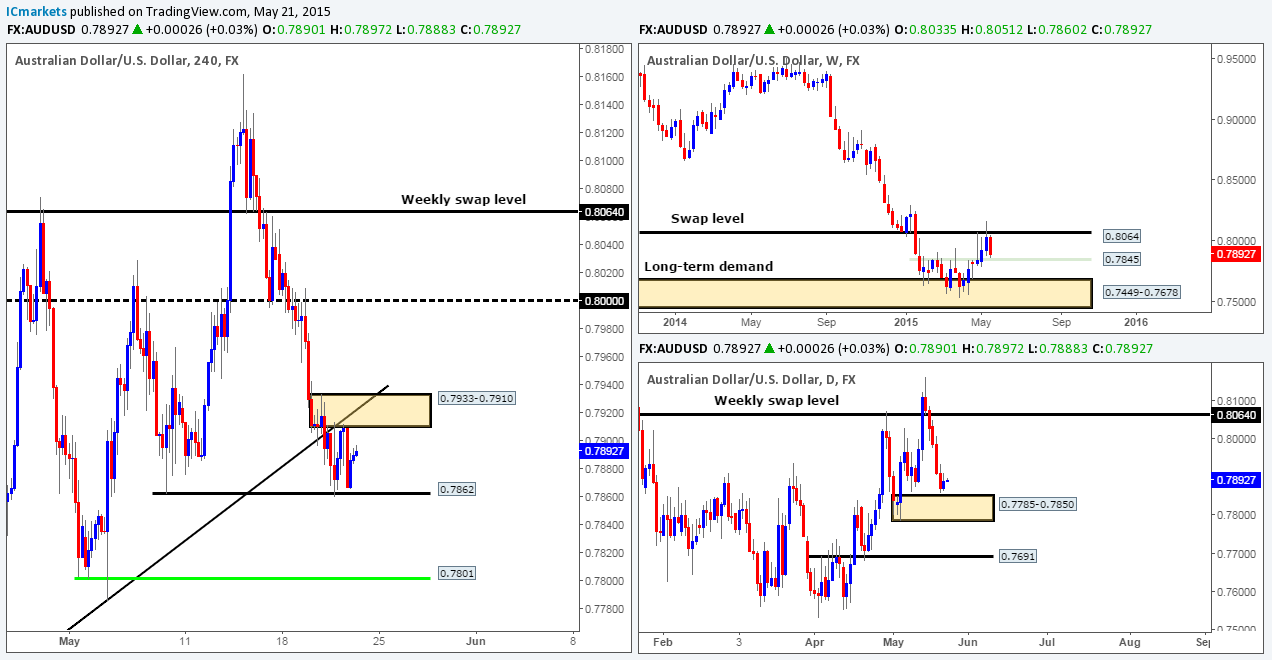
Weekly view: It’s too early to tell yet, but it appears that the current weekly candle is taking very similar form to the previous week’s candle – a bearish pin from the underside of the weekly swap level at 0.8064. In this case, it will likely be a clear indication that the Aussie wants to test the weekly demand area seen below at 0.7449-0.7678…
Daily view: The rebound seen from the daily supply area at 0.8074-0.8006 (positioned just below the aforementioned weekly swap level) saw follow-through selling during yesterday’s session. Provided that the sellers can continue with this tempo, we’ll likely see price test the 0.7875/0.7822 daily swap area sometime today.
4hr view: The AUD/USD pair, as you can see, failed to hold the market above 4hr demand at 0.7917-0.7940. Around mid-day London saw prices aggressively sell off, taking out this area and slam dunking itself right into round number support at 0.7900. Following this, a 4hr pin-bar candle formed, which appears to be failing as the recently broken 4hr demand zone is currently holding as supply.
In the event that price closes below 0.7900 today and is respected as resistance, we intend to look for confirmed (lower timeframe) sells here, with the mid-level mark 0.7850 in mind as a first take-profit target.
Levels to watch/ live orders:
- Buys: Flat (Predicative stop-loss orders seen at: N/A).
- Sells: Flat (Predicative stop-loss orders seen at: N/A).
USD/JPY:
Weekly view: For the past month and a half, the buyers and sellers have been seen battling for position within a weekly demand area coming in at 118.22-119.40. Our long-term bias will remain north on this pair as long as price continues to trade above the weekly swap level seen below this area at 115.50.
Daily view: From this angle, it appears the USD/JPY pair has begun chiseling out a consolidation zone between daily support seen at 118.62 (located deep within the aforementioned weekly demand area), and a daily Quasimodo resistance level coming in at 120.35. Recent action, however, shows that buying interest came into the market from just above the ascending daily trendline extended from the low 115.55.
4hr view: For those who read our previous report on this pair, you may recall us mentioning to watch for lower timeframe selling opportunities around the mid-level number 119.50. As you can see, a reaction did take place, which saw the 15 minute timeframe provide selling confirmation in the form of nice-looking bearish Harmonic Gartley pattern. We unfortunately missed this setup, which is a shame since price hit its target area 119.00. We hope some of our readers managed to lock in some green pips from this move!
Following price hitting the 119.00 region, prices surged north, taking out 119.50, and coming within a stone’s throw away from hitting 4hr supply at 120.03-119.87. Considering that the market is trading from overall demand on the higher-timeframe picture (see above) at the moment, we believe a move north will eventually take place (NFP dependent of course) and test the aforementioned 4hr supply area. Caution is advised if you’re considering selling at this zone, since at that point you’ll be crossing swords with higher-timeframe opposition (see above).
With everything taken into consideration, we do not see any immediate opportunity to trade at this time. Therefore, our team has opted to remain flat until at least after the NFP dust has settled.

Levels to watch/ live orders:
- Buys: Flat (Predicative stop-loss orders seen at: N/A).
- Sells: Flat (Predicative stop-loss orders seen at: N/A).
USD/CAD:
Weekly view: It’s too early to tell yet, but it appears (similar to the weekly chart of the AUD/USD) that the current weekly candle is taking very similar form to the previous week’s candle – a bullish pin rejecting the 1.1940 mark. Should the week close out forming yet another pin-bar candle, this may suggest that the Loonie pair potentially wants higher prices.
Daily view: The daily timeframe shows that supportive pressure is being seen from a daily demand zone coming in at 1.1931-1.2045, which, as you can probably see, converges so beautifully with Harmonic Bat support completing at 1.1921. Although this timeframe shows strong support, it has still failed on two occasions to convincingly close above the mid-level number 1.1250. Let’s see what the 4hr timeframe has to say about this…
4hr view: Yesterday’s sessions saw nothing but blue! The sellers saw very little action. This sharp ascent consumed not only 4hr supply seen at 1.2086-1.2066, but also the round number 1.2100. It was only once we saw London close did we see price reverse at the mid-level number 1.2150, which boasts additional resistance from the down trend line extended from the high1.2304.
Current action shows that price is seen rebounding from the 1.2100 support. Should the buyers be able to defend this level and close above the 4hr trendline, its likely further upside will be seen today towards 1.2200. For those looking to trade 1.2100 today, take note of the recently broken 4hr supply zone looming just below it at 1.2086-1.2066, this could provide support to the market and would be an absolutely fantastic area for pro money to fake price below 1.2100, so watch your stops here guys. Of course, all of the above is dependent on what numbers the NFP churns up later on today. There is a very strong possibility that price action could consolidate around 1.2100 until the NFP starts its engines. If this does occur, you may want to cover, or at least protect, any long position taken from 1.2100 and wait for the announcement to take place since being on the wrong side of the NFP is not a pretty picture!

Levels to watch/live orders:
- Buys: 1.2100 [Tentative – confirmation required] (Predicative stop-loss orders seen at: dependent on where one confirms this area).
- Sells: Flat (Predicative stop-loss orders seen at: N/A)
USD/CHF:
Weekly view: The weekly timeframe shows that price has now broken below the weekly demand area seen at 0.9170-0.9343. Assuming that this break is genuine and not a fakeout for higher prices, the path south looks ‘support free’ down until the 0.9018 weekly swap level.
Daily view: From the daily timeframe, we can see that once again price spiked below daily demand at 0.9155-0.9206 (located deep within weekly demand at 0.9170-0.9343), but this time came within 25 pips of hitting daily demand at 0.8933-0.9045 before prices rocketed north.
4hr view: The USD/CHF pair, as you can see, held firm below the 0.9165 4hr level yesterday, which in turn saw prices plunge towards 4hr demand at 0.8984-0.9068 (located just above daily demand area mentioned above at 0.8933-0.9045). This 4hr demand spring boarded this pair north, eventually closing above 0.9200.
0.9200 will likely be a key level to watch today, as price could potentially consolidate around this number ahead of the NFP announcement. Levels to keep an eye on during NFP are as follows:
- 0.9165, watch for prices to fake below 0.9200 into this level.
- There is also the chance price may attack the 4hr demand area mentioned above at 0.8984-0.9068, since there are likely a ton of unfilled buy orders lurking in this vicinity.
- 4hr supply seen at 0.9279-0.9262. This area could see a reaction due to how fresh this level is.
- The 4hr supply area seen above at 0.9331-0.9295, which also holds round-number resistance 0.9300 within.

Levels to watch/ live orders:
- Buys: 0.9165 [Tentative – confirmation required] (Predicative stop-loss orders seen at: dependent on where one confirms this level) 0.8984-0.9068 [Tentative – confirmation required] (Predicative stop-loss orders seen at: 0.8977).
- Sells: 0.9279-0.9262 [Tentative – confirmation required] (Predicative stop-loss orders seen at: 0.9284) 0.9331-0.9295 [Tentative – confirmation required] (Predicative stop-loss orders seen at: 0.9337).
US 30:
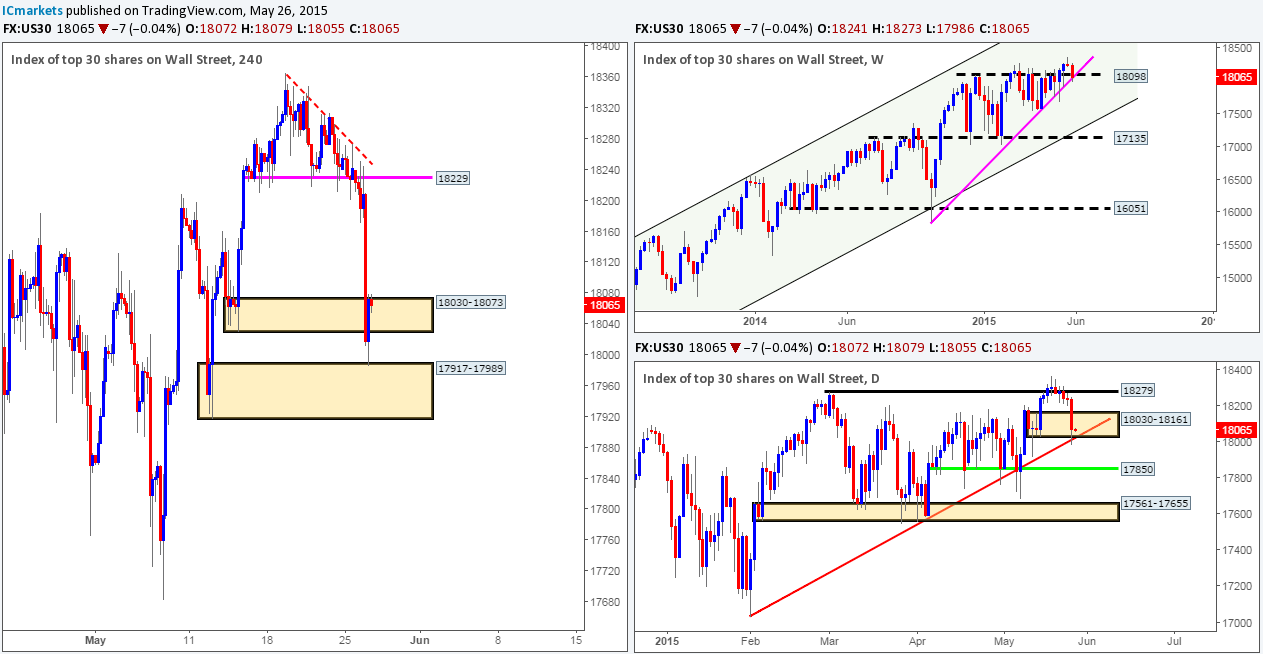
Weekly view: Although the overall trend has been strong since early 2009, a temporary ‘ceiling’ to this index has formed around the 18098 region which has remained strong for an impressive four months!
Daily view: From this angle, we can see that price has once again rebounded from the 17850 daily level (trendline convergence seen from the low 17033). This – coupled with that fact that resistive pressure is being seen from daily supply at 18207-18117 has clearly thrown this index into a phase of consolidation.
4hr view: Looking at the 4hr scale, the first things that come to mind is what a mess! However, when you minimize the chart, one may be able to see that the DOW has been forming what we believe to be a long-term 4hr bullish pennant formation – upper 4hr trendline extends from the high18279, while the lower 4hr line has been taken from the low 17556.
Despite the recent break below the lower limit trendline, and its converging daily support barrier 17850, we believe the 4hr pennant formation remains strong. The recent advance on this index forced price to shake hands with a mid-range 4hr supply area seen at 18027-17971. Trading short from this 4hr zone is something we have no interest in taking part in simply because price has a higher probability of breaking through this area and attacking the 18110 4hr resistance level, which converges nicely with the upper limit trendline extreme that forms the 4hr pennant. Therefore to wrap this up, we only plan to take action if 18118 or 17850 are hit during today’s sessions.
Levels to watch/live orders:
- Buys: 17850 [Tentative – confirmation required] (Predicative stop-loss orders seen at: dependent on where one confirms this level).
- Sells: 18110 [Tentative – confirmation required] (Predicative stop-loss orders seen at: dependent on where one confirms this level).
XAU/USD (Gold)
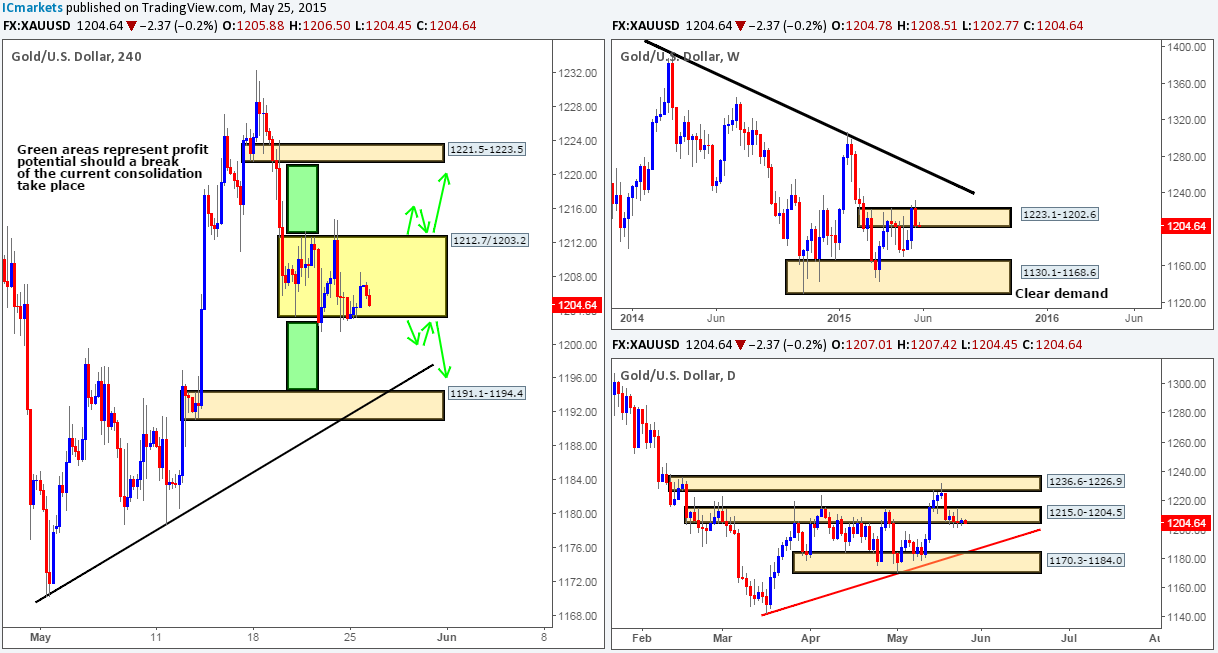
Weekly view: From a weekly standpoint, the trend on Gold is still firmly south, and will remain that way in our opinion until price closes above the weekly trendline extended from the high 1488.0. Current trading action, however, shows that price continues to linger between daily supply seen at 1223.1-1202.6 and weekly demand coming in at 1130.1-1168.6.
Daily view: The latest coming in from the daily timeframe reveals that price once again tested daily support at 1178.3. This support has held firm on four occasions now, yet each time no higher high formed which could suggest buying weakness. A close below this level would not be the end of the world for the buyers mind you; daily demand at 1159.4-1170.8 (located just within the aforementioned weekly demand area) is looming just below to save the day.
4hr view: Yesterday’s sessions saw the Gold market take a tumble. The rebound from the 1192.7 minor 4hr swap level was clearly enough to attract further sellers. This sell off took out two 4hr demand areas (1185.6-1187.4/1180.4-1183.5), and only saw any real notable buying interest once prices collided with the upper limits of a small 4hr demand zone coming in at 1177.6-1178.6. With this area currently providing support to the market, and the recently broken 4hr demand area at 1185.6-1187.4 capping the market to the upside, we appear to be for the time being trapped so to speak. Taking all of the above into account, we feel there is a good chance that price will consolidate between these two extremes through both the Asian session and mid-way through the London’s session as well. The extremes may be tested during this time and potential short-term bounce trades could be possible, but once the NFP gets under way, we’ll likely see a break of one of the aforementioned 4hr extremes. As long as a retest is seen with some sort of lower timeframe confirming signal following this break, a nice intraday trade could present itself to end the week on.
A break and retest above this 4hr capped area would likely see prices target 1192.7, or given enough time, the 4hr supply area seen at 1197.4-1195.3. Conversely, should we see prices slip below this 4hr capped zone, further downside could target the small 4hr demand area just mentioned above at 1168.6-1170.8.
Levels to watch/live orders:
- Buys: 1177.6-1178.6 [Tentative – confirmation required] (Predicative stop-loss orders seen at: 1178.8).
- Sells: 1185.6-1187.4 [Tentative – confirmation required] (Predicative stop-loss orders seen at: 1188.5).
The post Friday 8th May: Volatility is expected in the markets today as the NFP release takes center stage. appeared first on .
Source:: Friday 8th May: Volatility is expected in the markets today as the NFP release takes center stage.


