
Previous Story
GBP/USD: plan for the European session on Apr 10, 2020
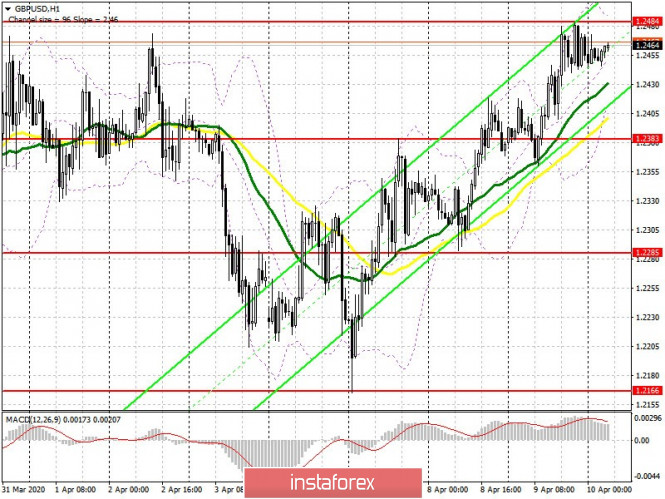
To open long positions on GBP/USD, you need:
Given that many markets are closed today due to Good Friday, buyers of the British pound are unlikely to be able to break through the important resistance of 1.2484. The task of the bulls will be to break through and consolidate above this range, which will result in dismantling the bears’ stop orders and further, a powerful growth of the pound with reaching highs of 1.2605 and 1.2686, where I recommend taking profits. If the pair declines, I advise that you return to long positions only after the test of the lower middle of the side channel of 1.2363-83, provided that a false breakout is formed there, or buy GBP/USD immediately for a rebound from a large level of 1.2285, counting on a correction of 40-50 points within the day. Since there are no important fundamental statistics in the first half of the day, amid low trading volume, speculators can take control of the market, which can lead to a sharp movement in one direction or another, with the same sharp return to a fair price.
To open short positions on GBP/USD, you need:
Sellers of the pound could not regain the 1.2383 area, and so they retreated from the market to test a larger resistance, which is the upper limit of the side channel of 1.2484. The formation of a false breakout there in the first half of the day will be a signal to open short positions in order to return to the support of 1.2383, which is the middle of the channel. Bad data on the state of US inflation will help the bears. Weak data will remind traders of the current state of the economy, which could return demand for safe-haven assets. A return and consolidation below the level of 1.2383 will result in the pair’s fall to the support area of 1.2285, the break of which will completely pull down the GBP/USD to a weekly low in the area of 1.2166, where I recommend taking profits. If the pound rises above the resistance of 1.2484, it is best to return to short positions only on the test of more recent highs of 1.2605 and 1.2686.
Signals of indicators:
Moving averages
Trading is slightly above 30 and 50 moving averages, which indicates the advantage of buyers of the pound.
Note: The period and prices of moving averages are considered by the author on the hourly chart H1 and differs from the general definition of the classic daily moving averages on the daily chart D1.
Bollinger bands
A break of the upper border of the indicator at 1.2484 will result in a larger increase in the pound. A breakout of the lower boundary in the region of 1.2419 may raise the pressure on the pair.
Description of indicators
- Moving average (moving average determines the current trend by smoothing out volatility and noise). Period 50. The graph is marked in yellow.
- Moving average (moving average determines the current trend by smoothing out volatility and noise). Period 30. The graph is marked in green.
- MACD indicator (Moving Average Convergence / Divergence – moving average convergence / divergence) Fast EMA period 12. Slow EMA period 26. SMA period 9
- Bollinger Bands (Bollinger Bands). Period 20
The material has been provided by InstaForex Company – www.instaforex.com


