
Previous Story
GBP/USD: plan for the European session on Apr 16, 2020
To open long positions on GBP/USD, you need:
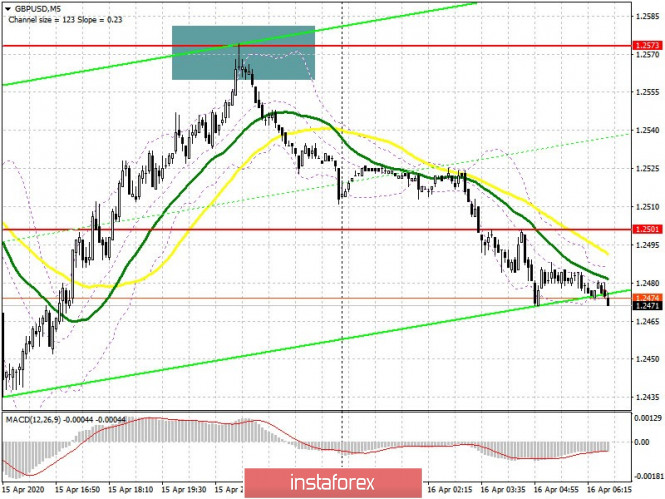
The rapid upward correction of the pair, which could be observed in the second half of the day, ended immediately after the price reached the 1.2573 level, from which I advised opening short positions yesterday. As we can see on the 5-minute chart, this entry brought more than 100 points of profit. Given that no important fundamental statistics are expected for the UK economy today, the focus will be on data on the US labor market. In the first half of the day, buyers will try to regain the resistance of 1.2501, a break above which can form a larger upward correction with a test of the 1.2573 level, where I advise taking profits. The longer-term goal will be a weekly high around 1.2632. However, more rational purchases are best considered with a downward correction to the low of 1.2402, and buy the pound immediately on the rebound in the expectation of a correction of 40-50 points within the day. Larger bulls will show themselves only after updating 1.2294.
To open short positions on GBP/USD, you need:
Sellers of the pound will be active after returning to the resistance of 1.2501, where a false breakout will be the first signal to open short positions. The nearest weekly target that bears will aim for is the support of 1.2402, the break of which will lead to a larger fall in GBP/USD to the area of a low of 1.2294, where I recommend fixing profits. If the activity from the sellers of the pound at the level of 1.2501 and after meeting the moving average, it will not be marked, it is best to postpone short positions until the test of larger resistance 1.2573, or sell the pound immediately to rebound from the high of 1.2632, since it is rather difficult to predict market behavior now.
Signals of indicators:
Moving averages
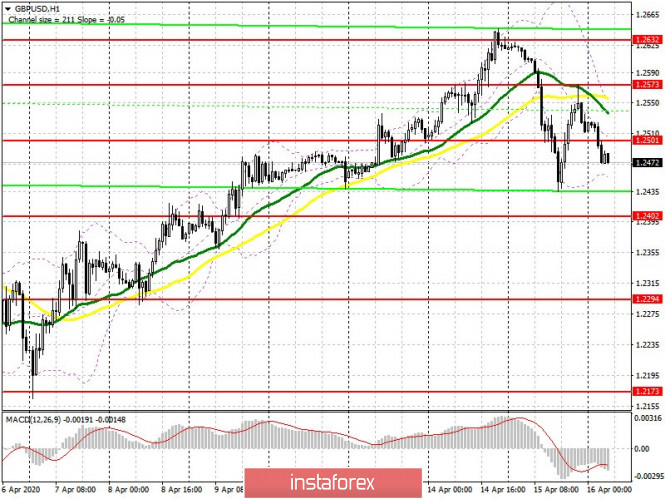
Trading is below 30 and 50 moving averages, indicating a bearish sentiment in the market.
Note: The period and prices of moving averages are considered by the author on the hourly chart H1 and differs from the general definition of the classic daily moving averages on the daily chart D1.
Bollinger bands
A break of the lower border of the indicator at 1.2450 will raise the pressure on the pound, while growth will be limited by the upper level at 1.2550.
Description of indicators
- Moving average (moving average determines the current trend by smoothing out volatility and noise). Period 50. The graph is marked in yellow.
- Moving average (moving average determines the current trend by smoothing out volatility and noise). Period 30. The graph is marked in green.
- MACD indicator (Moving Average Convergence / Divergence – moving average convergence / divergence) Fast EMA period 12. Slow EMA period 26. SMA period 9
- Bollinger Bands (Bollinger Bands). Period 20
The material has been provided by InstaForex Company – www.instaforex.com


