
Previous Story
GBP/USD: plan for the European session on Apr 30, 2020
To open long positions on GBP/USD, you need:
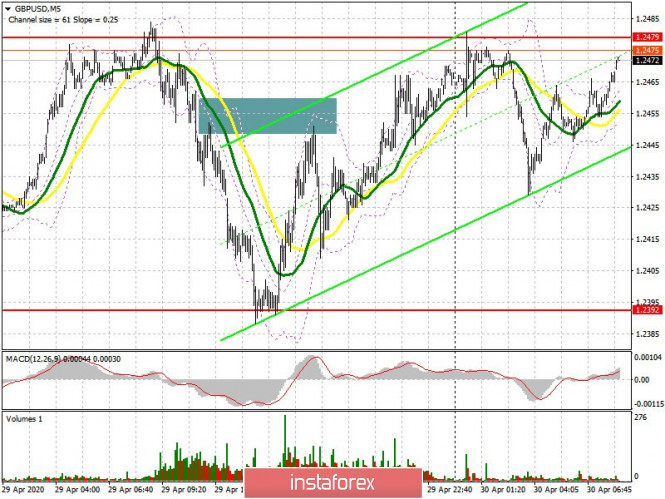
The pound sharply fell during the European session and then it faced rapid growth, with a little attempt by the bears to return to the market from the resistance of 1.2445, which I paid attention to in yesterday’s forecast, indicates an active opposition, which is still left for buyers. On the 5-minute chart, you can clearly see the bears’ attempt to return to the market and continue the downward trend that formed at the beginning of the day. At the moment, the bulls are focused on breaking the resistance of 1.2479, consolidating above this level will be a signal to buy GBP/USD in the hope of continuing the upward correction to the highs of 1.2526 and 1.2573, where I recommend taking profits. No important fundamental statistics are expected for the UK today, so in case the pound falls in the first half of the day, by analogy with yesterday, it is best to return to long positions on a false breakout from the support of 1.2392, but you can buy GBP/USD immediately for a rebound only after testing the larger lows of 1.2327 and 1.2300 based on a rebound of 30-40 points within the day.
To open short positions on GBP/USD, you need:
Sellers are active with each increase in the British pound, which is clearly visible on the chart, but to return the market under their control, they need to form a false breakout in the resistance area of 1.2479, since a lot depends on it. If the bears do not allow the pair to go higher, then most likely the pressure on the pound will return, and it will be possible to observe a decline in the area of a major support of 1.2392, where I recommend taking profits in the first half of the day. An equally important task will be to consolidate under this range, since only then can we talk about the return of the downward trend, which can lead to an update of the lows of 1.2327 and 1.2300. In case GBP/USD grows above the resistance of 1.1479 in the first half of the day and sellers are not active at this level, it is best to abandon short positions to test the more important resistance of 1.2526, or sell immediately for a rebound from the high of 1.2573 per correction of 30-40 points intraday.
Signals of indicators:
Moving averages
Trade is carried out in the region of 30 and 50 moving average, which indicates some uncertainty regarding the future direction.
Note: The period and prices of moving averages are considered by the author on the hourly chart H1 and differs from the general definition of the classic daily moving averages on the daily chart D1.
Bollinger bands
If the pound declines, support will be provided by the lower border of the indicator at 1.2392. A break of the upper border of the indicator in the area of 1.2485 will lead to a larger growth of the pound.
Description of indicators
- Moving average (moving average determines the current trend by smoothing out volatility and noise). Period 50. The graph is marked in yellow.
- Moving average (moving average determines the current trend by smoothing out volatility and noise). Period 30. The graph is marked in green.
- MACD indicator (Moving Average Convergence / Divergence – moving average convergence / divergence) Fast EMA period 12. Slow EMA period 26. SMA period 9
- Bollinger Bands (Bollinger Bands). Period 20
The material has been provided by InstaForex Company – www.instaforex.com


