
Previous Story
GBP/USD: plan for the European session on Dec 20, 2019
To open long positions on GBP/ USD, you need:
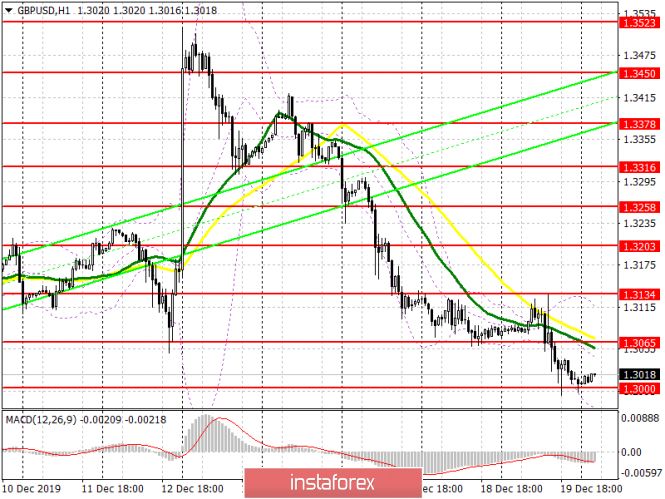
Yesterday’s statements by the Bank of England that the rate can be both raised and lowered if necessary, and uncertainty in this matter returned the pressure on the British pound, and the breakthrough of the level of 1.3065 is expected to lead to a new wave of decline. At the moment, buyers need to protect the support of 1.3000, and this will have to be done with any data on the UK economy. A good report can allow you to climb to the resistance of 1.3065, which will lead to the demolition of several stop orders of sellers and a larger upward correction in the area of the maximum of 1.3134, where I recommend taking the profits. In the scenario of a further decline below the level of 1.3000 on GDP data, I recommend returning to long positions only after the test of the minimum of 1.2952, or a rebound from the support of 1.2896.
To open short positions on GBP/USD, you need:
Yesterday, the bears showed activity after trying to return GBP/USD to the resistance level of 1.3134, which I paid attention to in my review, and the statements of the Bank of England pushed the pound below 1.3065. At the moment, sellers will defend the resistance of 1.3065, and the formation of a false breakout in this area, together with bad data on the UK economy, will be a direct signal to open short positions. Another equally important task for sellers will be a breakthrough and consolidation below the support of 1.3000, which will collapse the pound to the lows of 1.2952 and 1.2896, where I recommend taking the profits. With the pair rising above 1.3065 on good GDP data, it is best to return to short positions on the rebound from the high of 1.3134.
Indicator signals:
Moving Averages
Trading is below the 30 and 50 moving averages, which indicates a possible further decline in the pound.
Bollinger Bands
Support will be provided by the lower border of the indicator in the area of 1.2965, while growth will be limited to the upper level of the indicator in the area of 1.3080.
Description of indicators
- Moving average (moving average determines the current trend by smoothing volatility and noise). Period 50. The chart is marked in yellow.
- Moving average (moving average determines the current trend by smoothing volatility and noise). Period 30. The chart is marked in green.
- MACD indicator (Moving Average Convergence / Divergence – Convergence / Divergence of moving averages) – EMA Period 12. Slow EMA Period 26. SMA Period 9
- Bollinger Bands (Bollinger Bands). Period 20
The material has been provided by InstaForex Company – www.instaforex.com


