
Previous Story
GBP/USD: plan for the European session on Feb 14, 2020
To open long positions on GBP/USD you need:
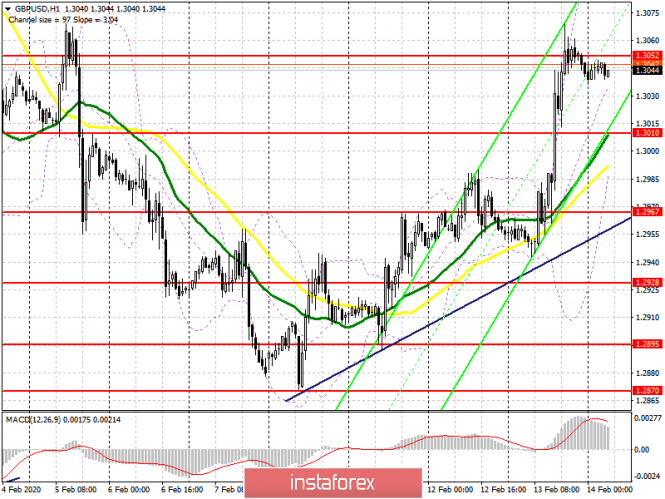
The upward trend continues, and yesterday’s news about the resignation of the UK Treasury Secretary, a tough opponent of the trade agreement between England and the EU, only strengthened the pound. Buyers managed the level of 1.2967, and also made their way above the 1.3007 range, which now acts as a serious support. The main objective of the bulls in the first half of the day will be a break and consolidation above the resistance of 1.3052, which will open a direct road to the area of highs 1.3093 and 1.3133, where I recommend taking profits. However, buyers may have problems after updating yesterday’s high when forming divergence on the MACD indicator. A more optimal scenario for opening long positions would be a downward correction to the support area of 1.3010, provided that there is a false breakout there, or a rebound purchase after the support test of 1.2967, where the lower boundary of the new ascending channel formed on February 10 is also passing.
To open short positions on GBP/USD you need:
Sellers are in no hurry to return to the market, and slight pullbacks are just profit-taking on long positions. The bears need to achieve the formation of a false breakout in the first half of the day, which can happen after an unsuccessful update of yesterday’s high with confirmation of divergence on the MACD indicator. If sellers are unable to implement this scenario, it is best to postpone short positions until the 1.3093 level is updated, or sell GBP/USD immediately to rebound from the resistance of 1.3133. An equally important goal for the bears will be the pound’s return to a support of 1.3010, as its breakthrough will increase the pressure on the pair, which will lead to a fall to the low of 1.2967, where I recommend taking profits.
Signals of indicators:
Moving averages
Trading is conducted above 30 and 50 moving average, which indicates the continuation of the upward correction in the pair.
Bollinger bands
If the pair decreases, support will be provided by the lower boundary of the indicator at 1.3000, while growth may be limited by the upper level at 1.3077.
Description of indicators
- Moving average (moving average determines the current trend by smoothing out volatility and noise). Period 50. The graph is marked in yellow.
- Moving average (moving average determines the current trend by smoothing out volatility and noise). Period 30. The graph is marked in green.
- MACD indicator (Moving Average Convergence / Divergence – moving average convergence / divergence) Fast EMA period 12. Slow EMA period 26. SMA period 9
- Bollinger Bands (Bollinger Bands). Period 20
The material has been provided by InstaForex Company – www.instaforex.com


