
Previous Story
GBP/USD: plan for the European session on Feb 17, 2020
To open long positions on GBP/USD you need:
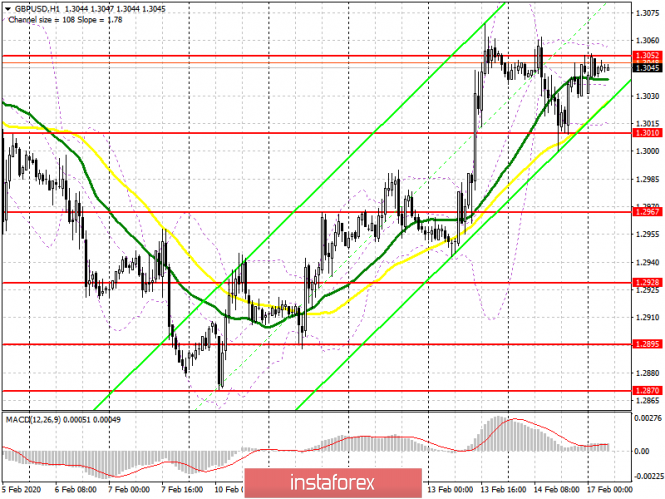
Buyers coped with a false breakout being formed in the support area of 1.3010 on Friday in the afternoon, which has already led the pound to a resistance of 1.3052, thus, determines the further direction of the pair. The main task of the bulls in the first half of the day will be a breakthrough and consolidation above this level, which will open a direct path to the area of highs 1.3093 and 1.3133, where I recommend taking profits. The more optimal scenario for opening long positions is the support of 1.3010, but, as at the end of last week, an important condition will be for a false breakout to form there. Buying for a rebound can only be considered at a support test of 1.2967. The lack of important fundamental statistics will help when buying the pound in order to push the pair upwards.
To open short positions on GBP/USD you need:
Sellers have already declared themselves on Friday, but failed to achieve a breakdown of 1.3010. This morning, the bears need a false breakout to form on the range of 1.3052, which can happen after an unsuccessful update of the previous week’s high. If sellers are not able to implement this scenario, it is best to postpone short positions until the level 1.3093 is updated, or sell GBP/USD immediately to rebound from a resistance of 1.3133. An equally important goal for the bears will be for the pound to return to a support of 1.3010, as its breakthrough will raise the pressure on the pair, which will lead to a decrease to the low of 1.2967, where I recommend taking profits.
Signals of indicators:
Moving averages
Trading is conducted slightly above 30 and 50 moving averages, which saves the likelihood of continued upward correction of the pound.
Bollinger bands
In case the pair declines, support will be provided by the lower boundary of the indicator at 1.3010, while growth may be limited by the upper level at 1.3052.
Description of indicators
- Moving average (moving average determines the current trend by smoothing out volatility and noise). Period 50. The graph is marked in yellow.
- Moving average (moving average determines the current trend by smoothing out volatility and noise). Period 30. The graph is marked in green.
- MACD indicator (Moving Average Convergence / Divergence – moving average convergence / divergence) Fast EMA period 12. Slow EMA period 26. SMA period 9
- Bollinger Bands (Bollinger Bands). Period 20
The material has been provided by InstaForex Company – www.instaforex.com


