
Previous Story
GBP/USD: plan for the European session on Nov 22, 2019
To open long positions on GBP/USD you need:
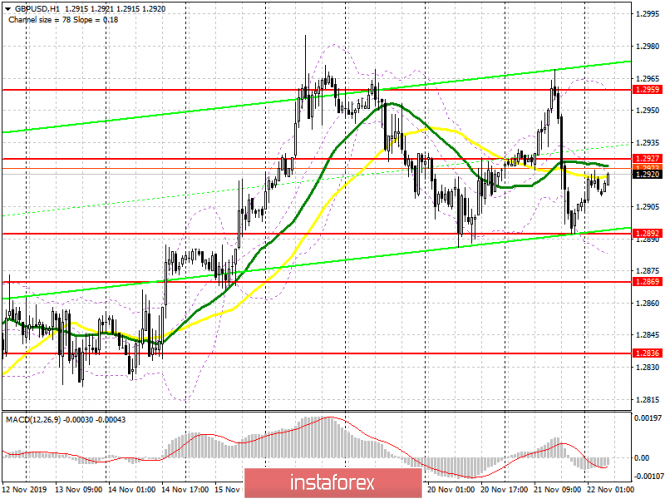
The bulls attempt to break above resistance if 1.2965, from which I recommended to open short positions in yesterday’s review. However, it was unsuccessful, which led to a decline of the pound to the area of week’s low, where buyers began to act more actively again. At the moment, support can be seen in the area of 1.2892, but opening long positions from it is only best after the formation of a false breakdown. A more important task for pound buyers will be to break and consolidate above the resistance of 1.2927. However, this will only happen if there is good data on activity in the services and manufacturing sectors in the UK. Only after that we can expect the continuation of growth with a return to resistance of 1.2959, where taking profits is recommended. If the data disappoint traders, it will lead to a breakdown of support for 1.289. In this scenario, it is best to rely on new GBP/USD purchases after updating the larger lows such as 1.2869 and 1.2836.
To open short positions on GBP/USD you need:
In the morning, sellers will try to protect the level of 1.2927, which will be the first signal to open short positions, but a return to support 1.2892 will be a more important task. Only its breakdown will increase the pressure on the pound, which allows us to count on updating the lows in the areas of 1.2869 and 1.2836, where taking profits is recommended. If data on activity in the UK services sector is better than the forecasts of economists, it is possible that the bulls will be able to break through the resistance of 1.2927. In this scenario, it is best to rely on short positions after updating the maximum of 1.2959, and you can also sell immediately for a rebound from the new area of 1.3017.
Signals of indicators:
Moving averages
Trade is conducted in the region of 30 and 50 moving average, which indicates the lateral nature of the market after an unsuccessful attempt to grow.
Bollinger bands
Growth will be limited by the upper level of the indicator, which practically coincides with the upper border of the side channel 1.2959. In case of GBP/USD decline, the lower border of the indicator in the area of 1.2880 will provide support.
Description of indicators
- Moving average (moving average determines the current trend by smoothing out volatility and noise). Period 50. The graph is marked in yellow.
- Moving average (moving average determines the current trend by smoothing out volatility and noise). Period 30. The graph is marked in green.
- MACD indicator (Moving Average Convergence / Divergence – Moving Average Convergence/Divergence). Fast EMA period 12. Slow EMA period 26. SMA period 9.
- Bollinger Bands (Bollinger Bands). Period 20.
The material has been provided by InstaForex Company – www.instaforex.com


