
Previous Story
GBP/USD: plan for the European session on Oct 1, 2019
To open long positions on GBP/USD you need:
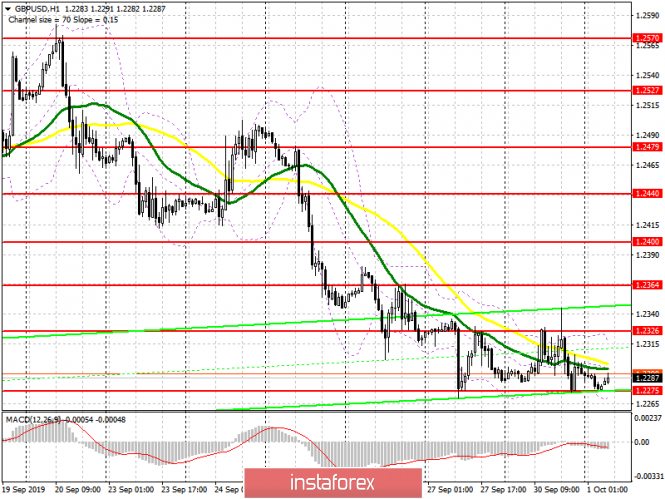
Several unsuccessful attempts to pull up the pound, after yesterday’s report on the reduction in GDP and a decrease in the volume of net loans, led to the return of sellers to the market. However, it was also not possible to break below the low of last week in the region of 1.2275. Only the formation of another false breakdown at this level will lead to an upward correction of the pair to the area of the upper boundary of the side channel of 1.2326, consolidating above which will strengthen the demand for GBP/USD, which will update resistance at 1.2364, where I recommend taking profits. If the level of 1.2275 is still broken on the UK manufacturing activity data, it is best to consider new purchases in GBP/USD after updating the lows near 1.2238 and 1.2165.
To open short positions on GBP/USD you need:
The bears were able to protect the level of 1.2326, which I paid attention to yesterday throughout the day. However, it will be possible to talk about the continuation of the bearish trend only after breaking the low of the week near 1.2275, which may lead to a further decrease in GBP/USD to 1.2238, however, the long-term goal of the bears in the middle of this week will be the support of 1.2165, where I recommend taking profit. If the pressure on the pair weakens, which can only happen after a good report on manufacturing activity in the UK is released, it is best to sell the pound after an upward correction to the upper boundary of the side channel, provided that there is a false breakdown there, or immediately to rebound from a high of 1.2364.
Signals of indicators:
Moving averages
Trading below 30 and 50 moving averages, indicating a bear market in the short term.
Bollinger bands
A break of the lower boundary of the indicator in the region of 1.2270 will lead to increased pressure on the pair, while growth will be limited by the upper level in the area of 1.2315.
Description of indicators
- MA (moving average) 50 days – yellow
- MA (moving average) 30 days – green
- MACD: Fast EMA 12, Slow EMA 26, SMA 9
- Bollinger Bands 20
The material has been provided by InstaForex Company – www.instaforex.com


