
Previous Story
GBP/USD analysis for March 06, 2017
Posted On 06 Mar 2017
Comment: 0
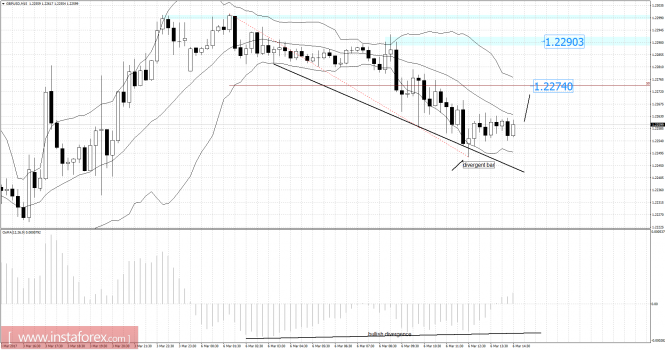
Recently, GBP/USD has been trading sideways at the price of 1.2260. According to the 15M time frame, I found a hidden bullish divergence on the moving average oscillator, which is a sign that selling looks risky. There is also a divergent bar, which is another sign of potential strength. My advice is to watch for potential intraday buying opportunities. I placed Fibonacci retracement to find potential target. Fibonacci retracement 50% is set at the price of 1.2275 (first target). The second target is set at the price of 1.2290 (swing high).
Resistance levels:
R1: 1.2300
R2: 1.2305
R3: 1.2310
Support levels:
S1: 1.2290
S2: 1.2285
S3: 1.2280
Trading recommendations for today: watch for potential buying opportunities due to bullish divergence in the background.
The material has been provided by InstaForex Company – www.instaforex.com
Source:: GBP/USD analysis for March 06, 2017


