
Previous Story
GBP/USD analysis for March 14, 2017
Posted On 14 Mar 2017
Comment: 0
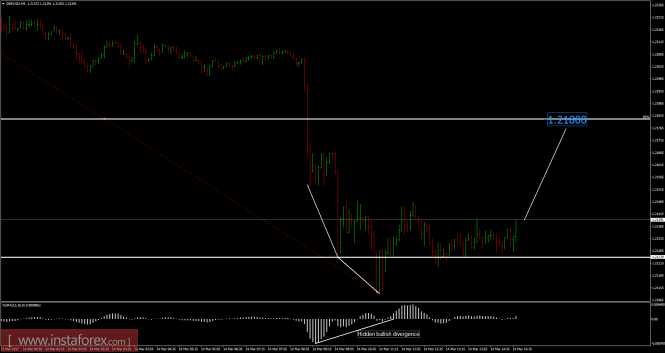
Recently, the GBP/USD pair has been trading downwards. The price tested the level 1.2109. According to the 5M time frame, I found hidden bullish divergence on the moving average osiclator and weak supply, which is sign that selling looks risky. My advice is to watch for potential intraday buying opportunities. Targets are set at the price of 1.2180 and 1.2200.
Resistance levels:
R1: 1.2245
R2: 1.2270
R3: 1.2310
Support levels:
S1: 1.2165
S2: 1.2140
S3: 1.2100
Trading recommendations for today: watch for potential intraday buying opportunities.
The material has been provided by InstaForex Company – www.instaforex.com
Source:: GBP/USD analysis for March 14, 2017


